In this series: Virginia 2024-25 Enrollment.
Virginia retained part of its enrollment rebound in 2024-25, but the count fell again. Public schools enrolled 1,261,670 students, down 592 from the year before and 36,413 below the 2019-20 peak. The net gain since 2020-21 equaled 19.7% of the preceding year's decline.
The statewide pattern reached places with very different histories. Norfolk City Public Schools↗ET enrolled 26,832 students in 2024-25, compared with 36,745 in 2002-03. Fairfax County Public Schools↗ET had 8,371 fewer students than at its 2019-20 peak.
The statewide gain of 11,635 students in 2022-23 was followed by declines in both subsequent reporting years. Enrollment fell in three of the four annual transitions ending in 2024-25. The counts alone do not establish how births, migration or movement between public and other schools contributed to the change.
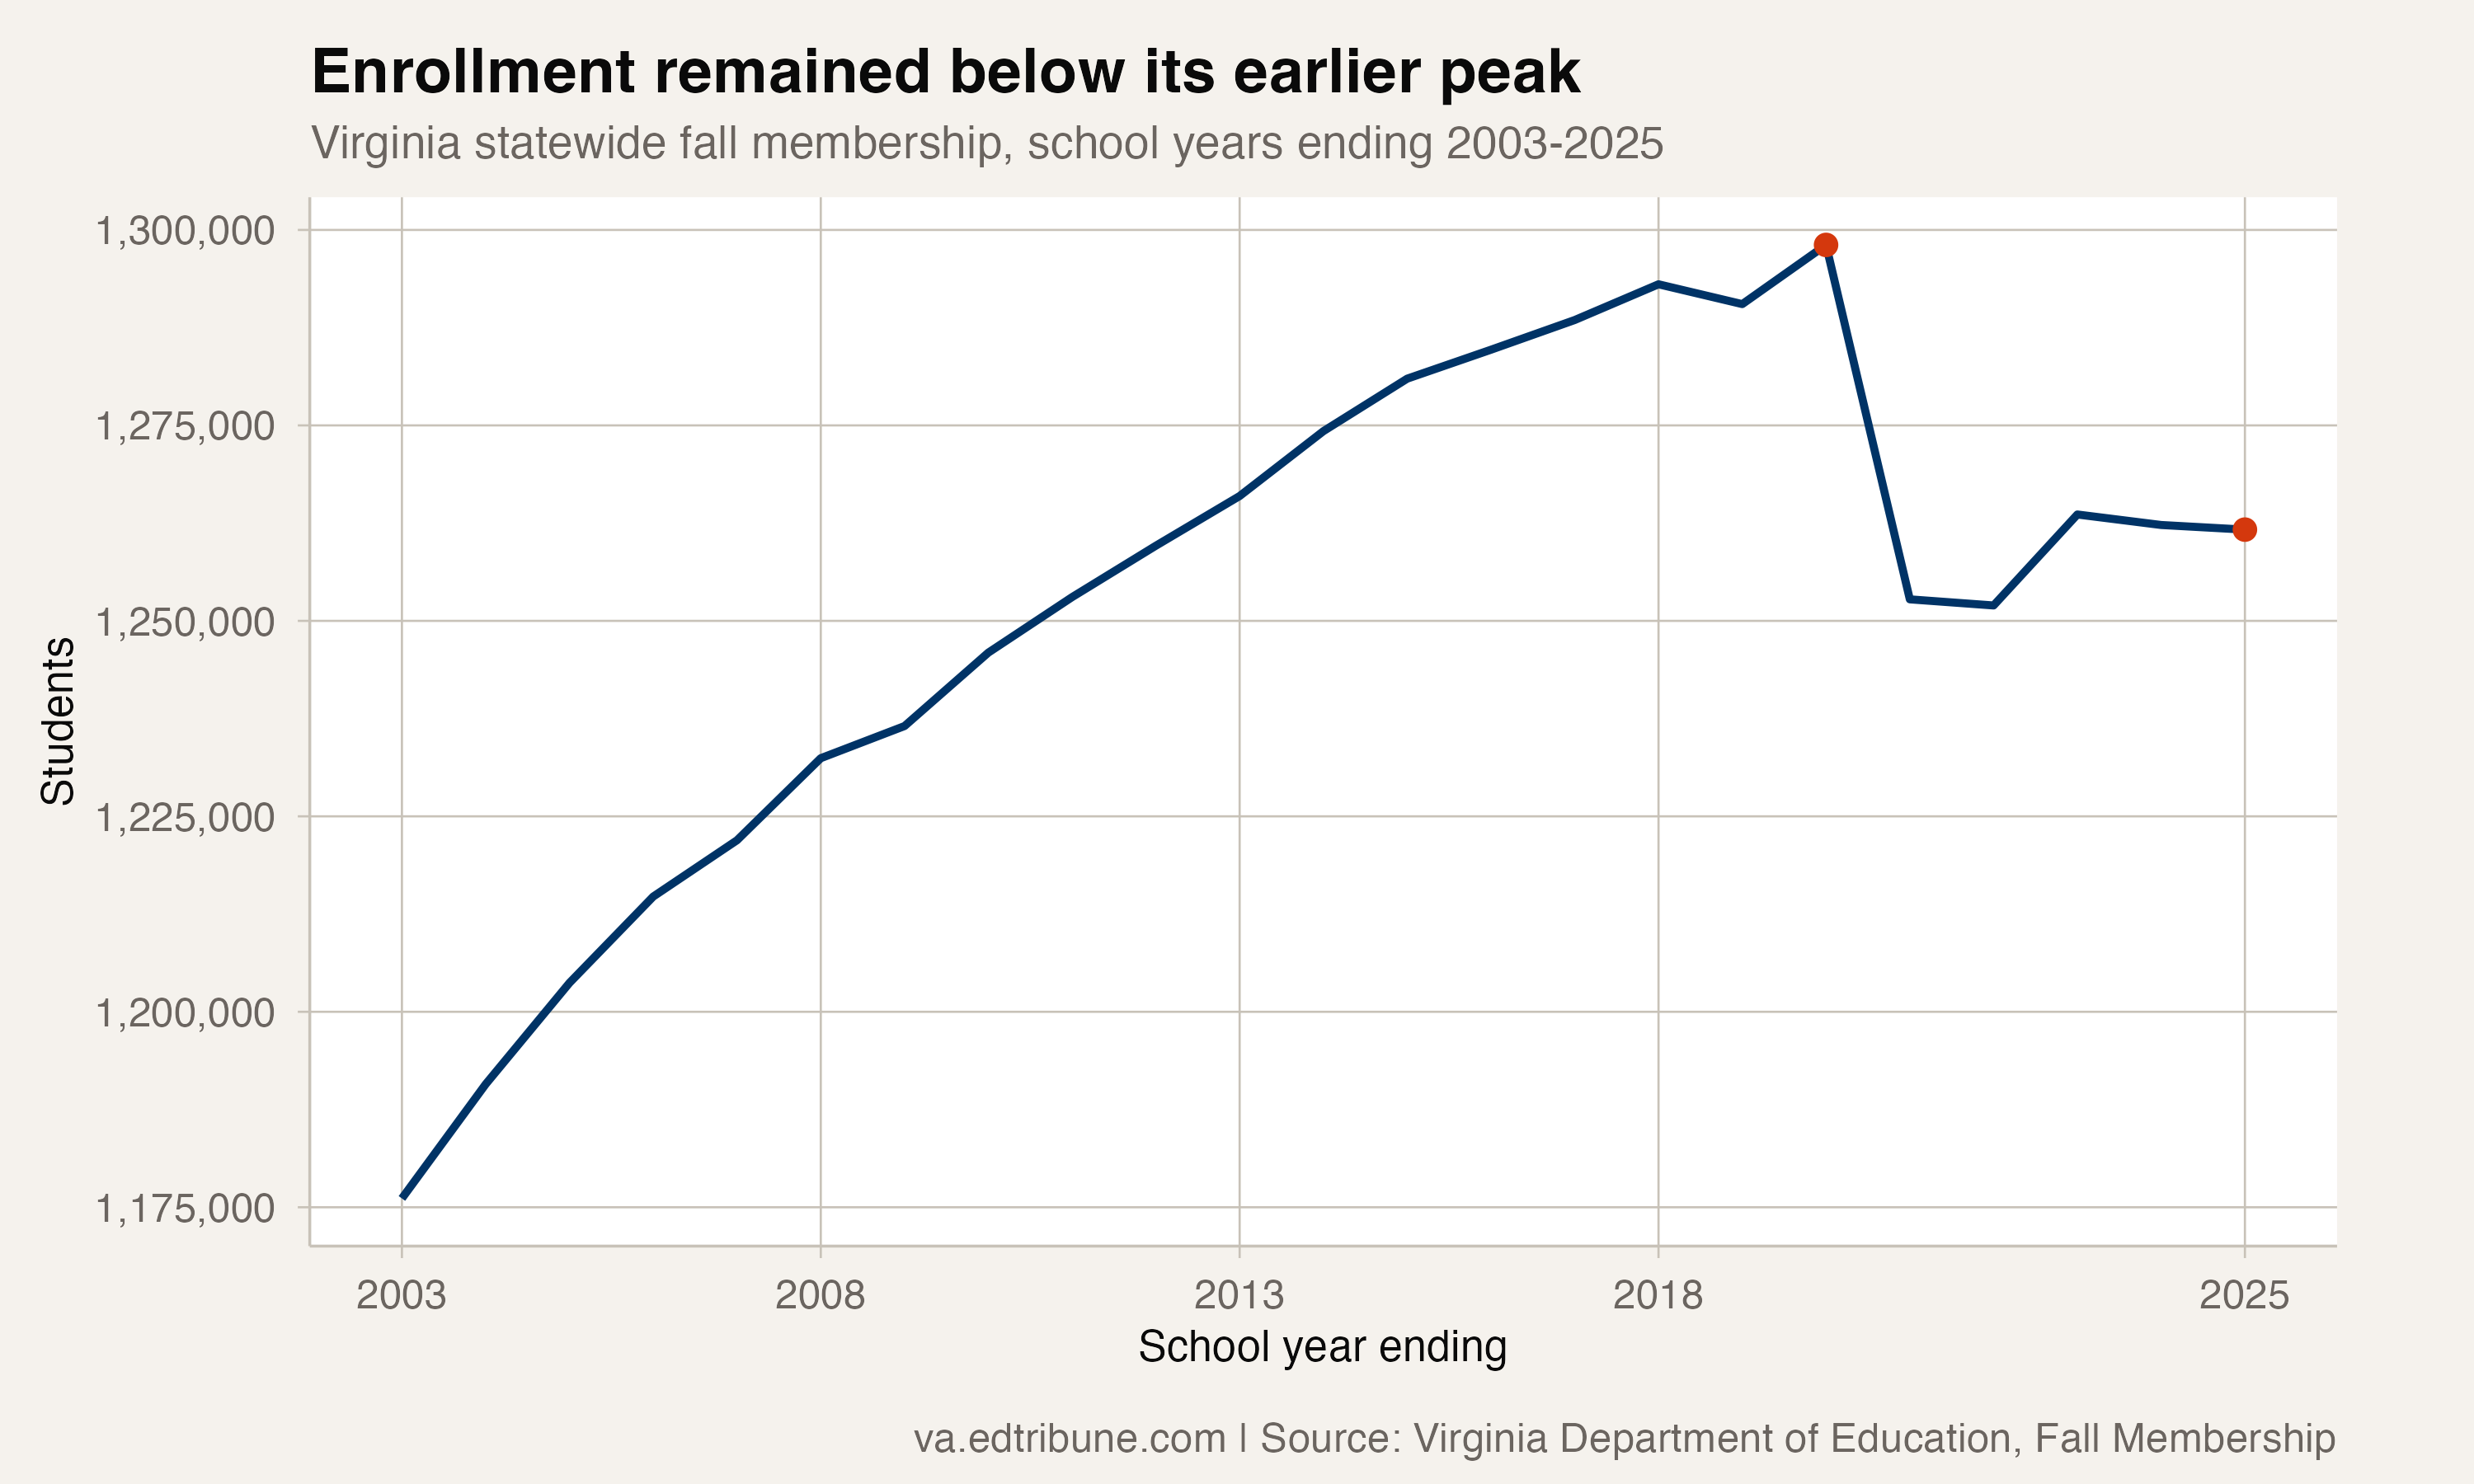
Most comparable divisions remained below their earlier counts
Of 130 school divisions with comparable totals in both 2019-20 and 2024-25, 96 enrolled fewer students at the later count. That is 73.8% of the comparison group. The comparison excludes Alleghany Highlands↗ET because its earlier division identity predates the merger with Covington City.
Norfolk's decline stretched across every adjacent year in the panel: 22 consecutive annual declines across 23 reporting years, from 2002-03 through 2024-25. Its enrollment fell 27.0% over that span. Across the full-history, nonmerged division panel, 43 divisions were at their lowest count in those records. These are historical-panel lows, not claims about every year since a division opened.
A changing student body
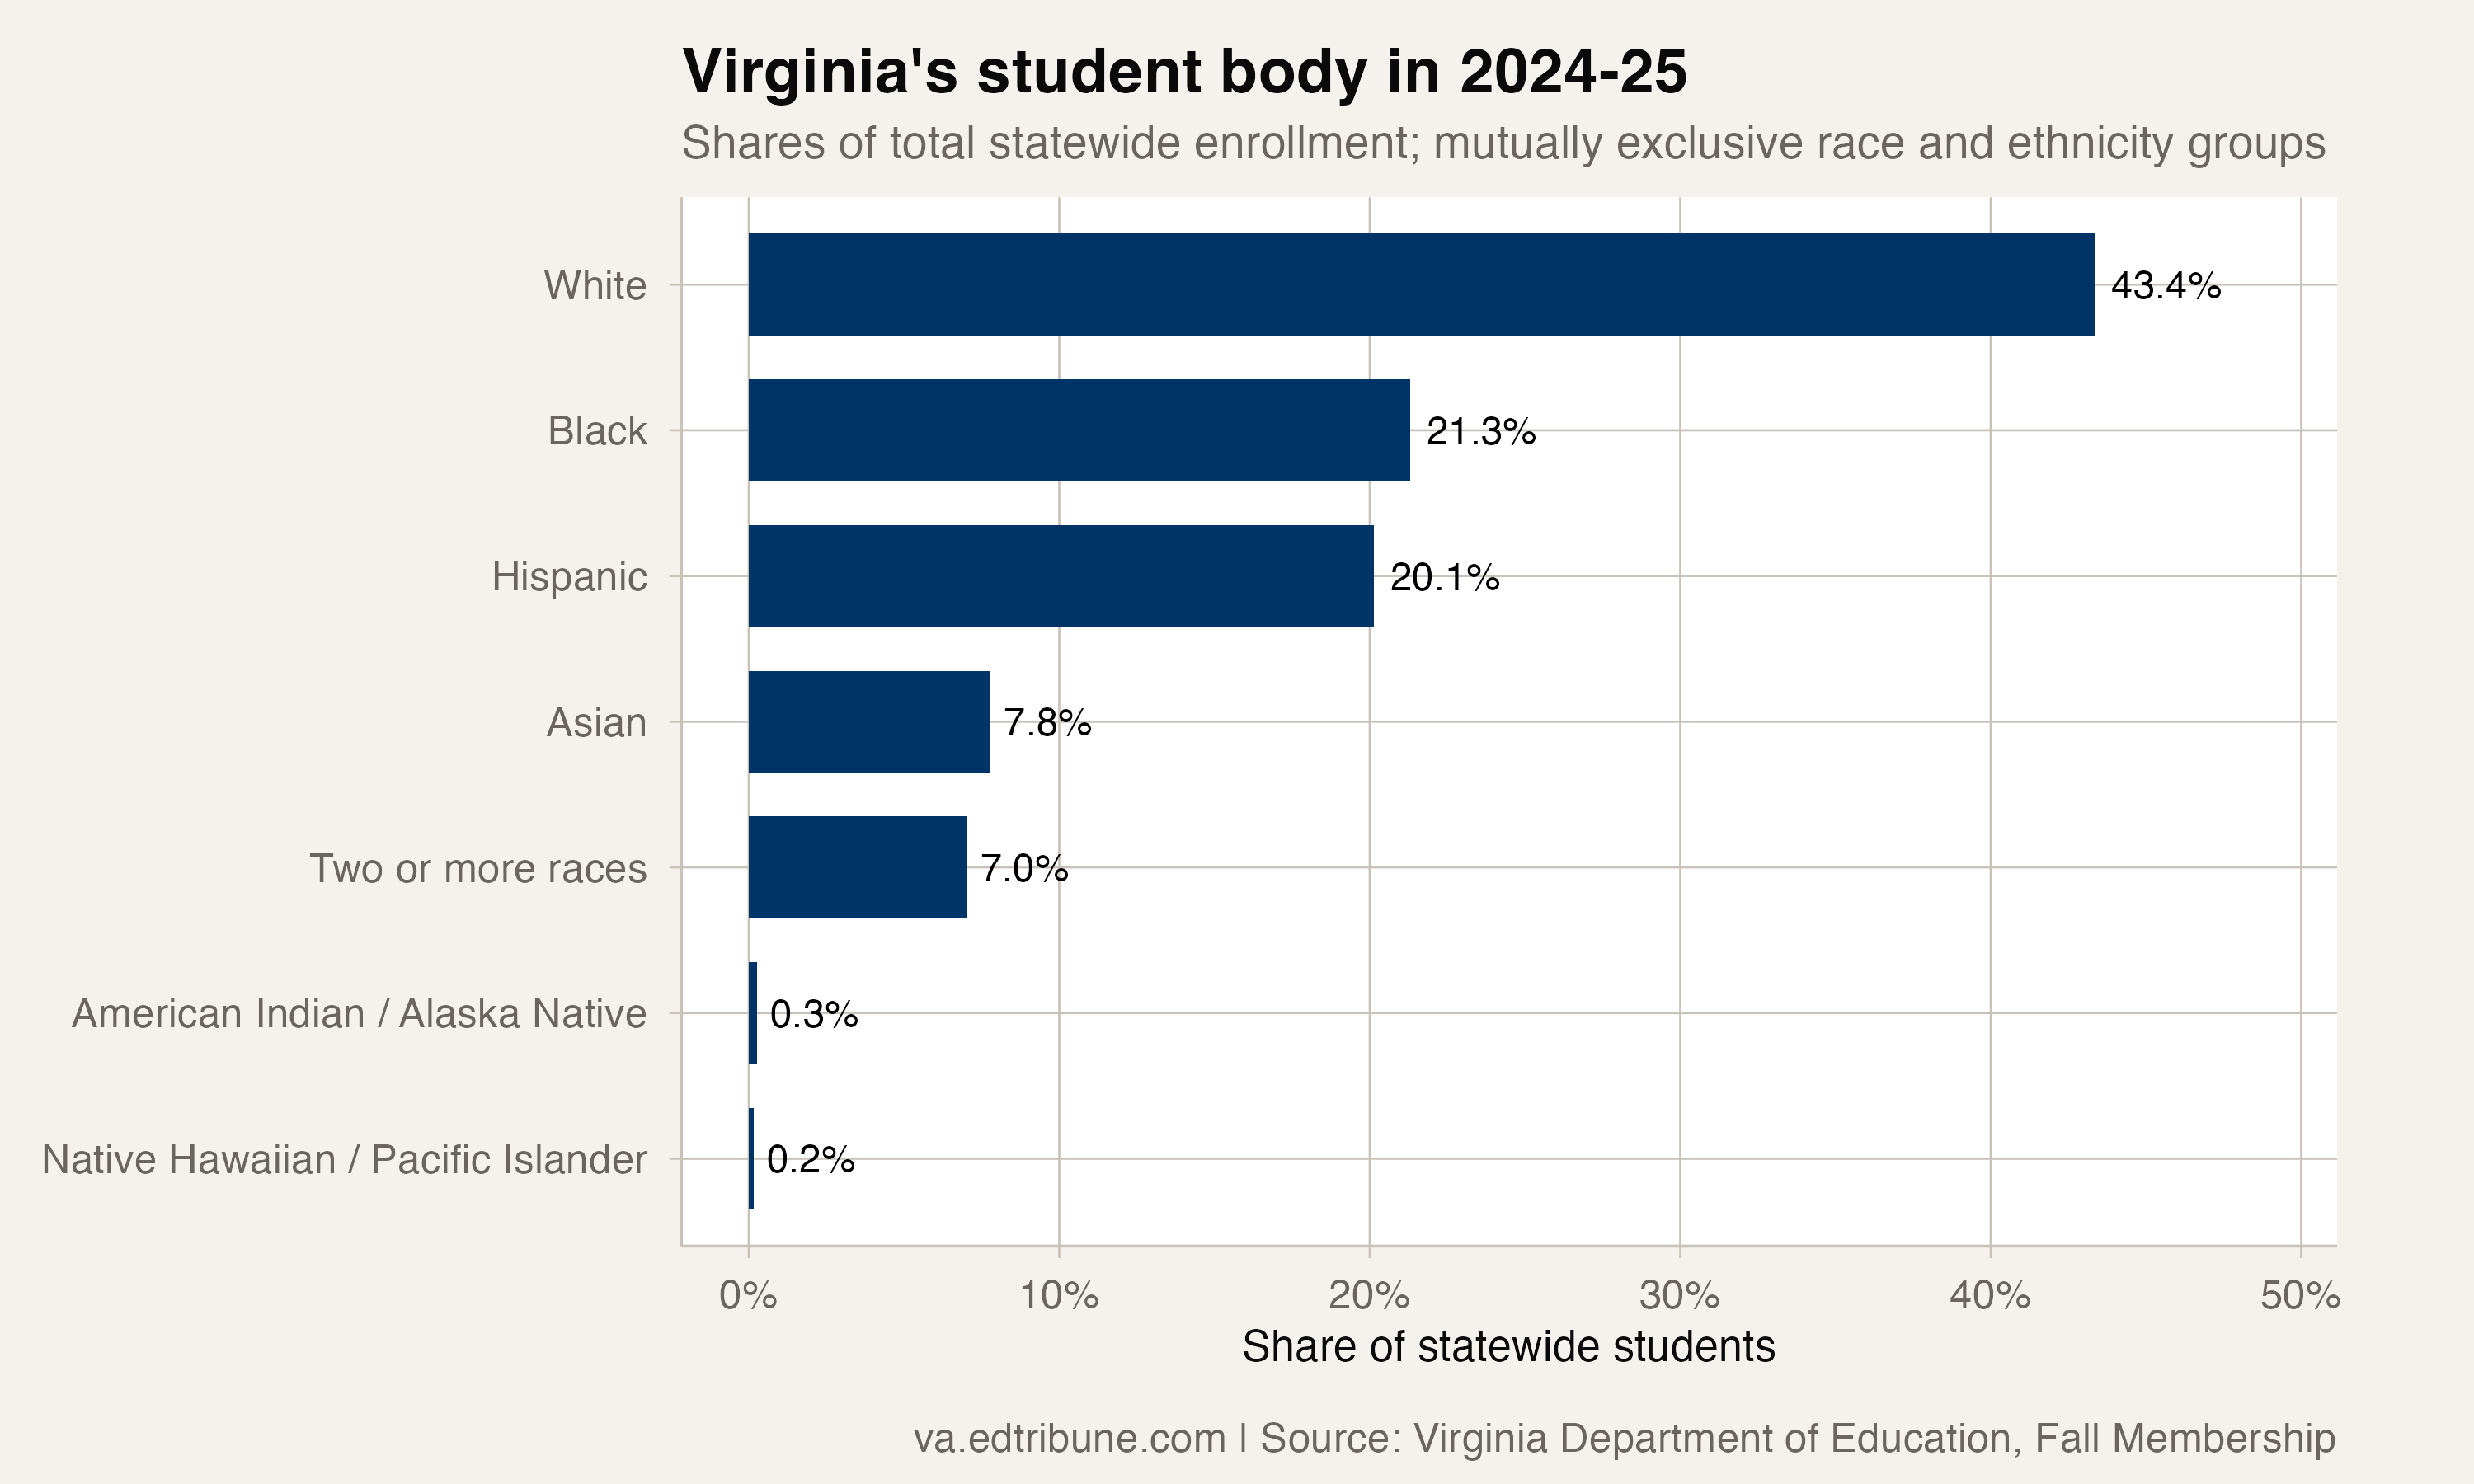
White students represented 43.4% of statewide enrollment in 2024-25; Hispanic students represented 20.1%. The chart uses the statewide enrollment total as its denominator and keeps the mutually exclusive race and ethnicity categories together.
English learner enrollment is a separate, overlapping classification. The count rose from 172,913 in 2022-23 to 187,596 in 2024-25, an 8.5% increase. English learners represented 14.9% of the statewide total at the later count. That change does not establish whether division staffing or budgets kept pace.
Smaller kindergarten classes than senior classes
Virginia counted 84,376 kindergartners and 97,429 students in twelfth grade in 2024-25, or 86.6 kindergartners per hundred seniors. Twelfth grade exceeded kindergarten across eight consecutive reporting years ending in 2024-25.
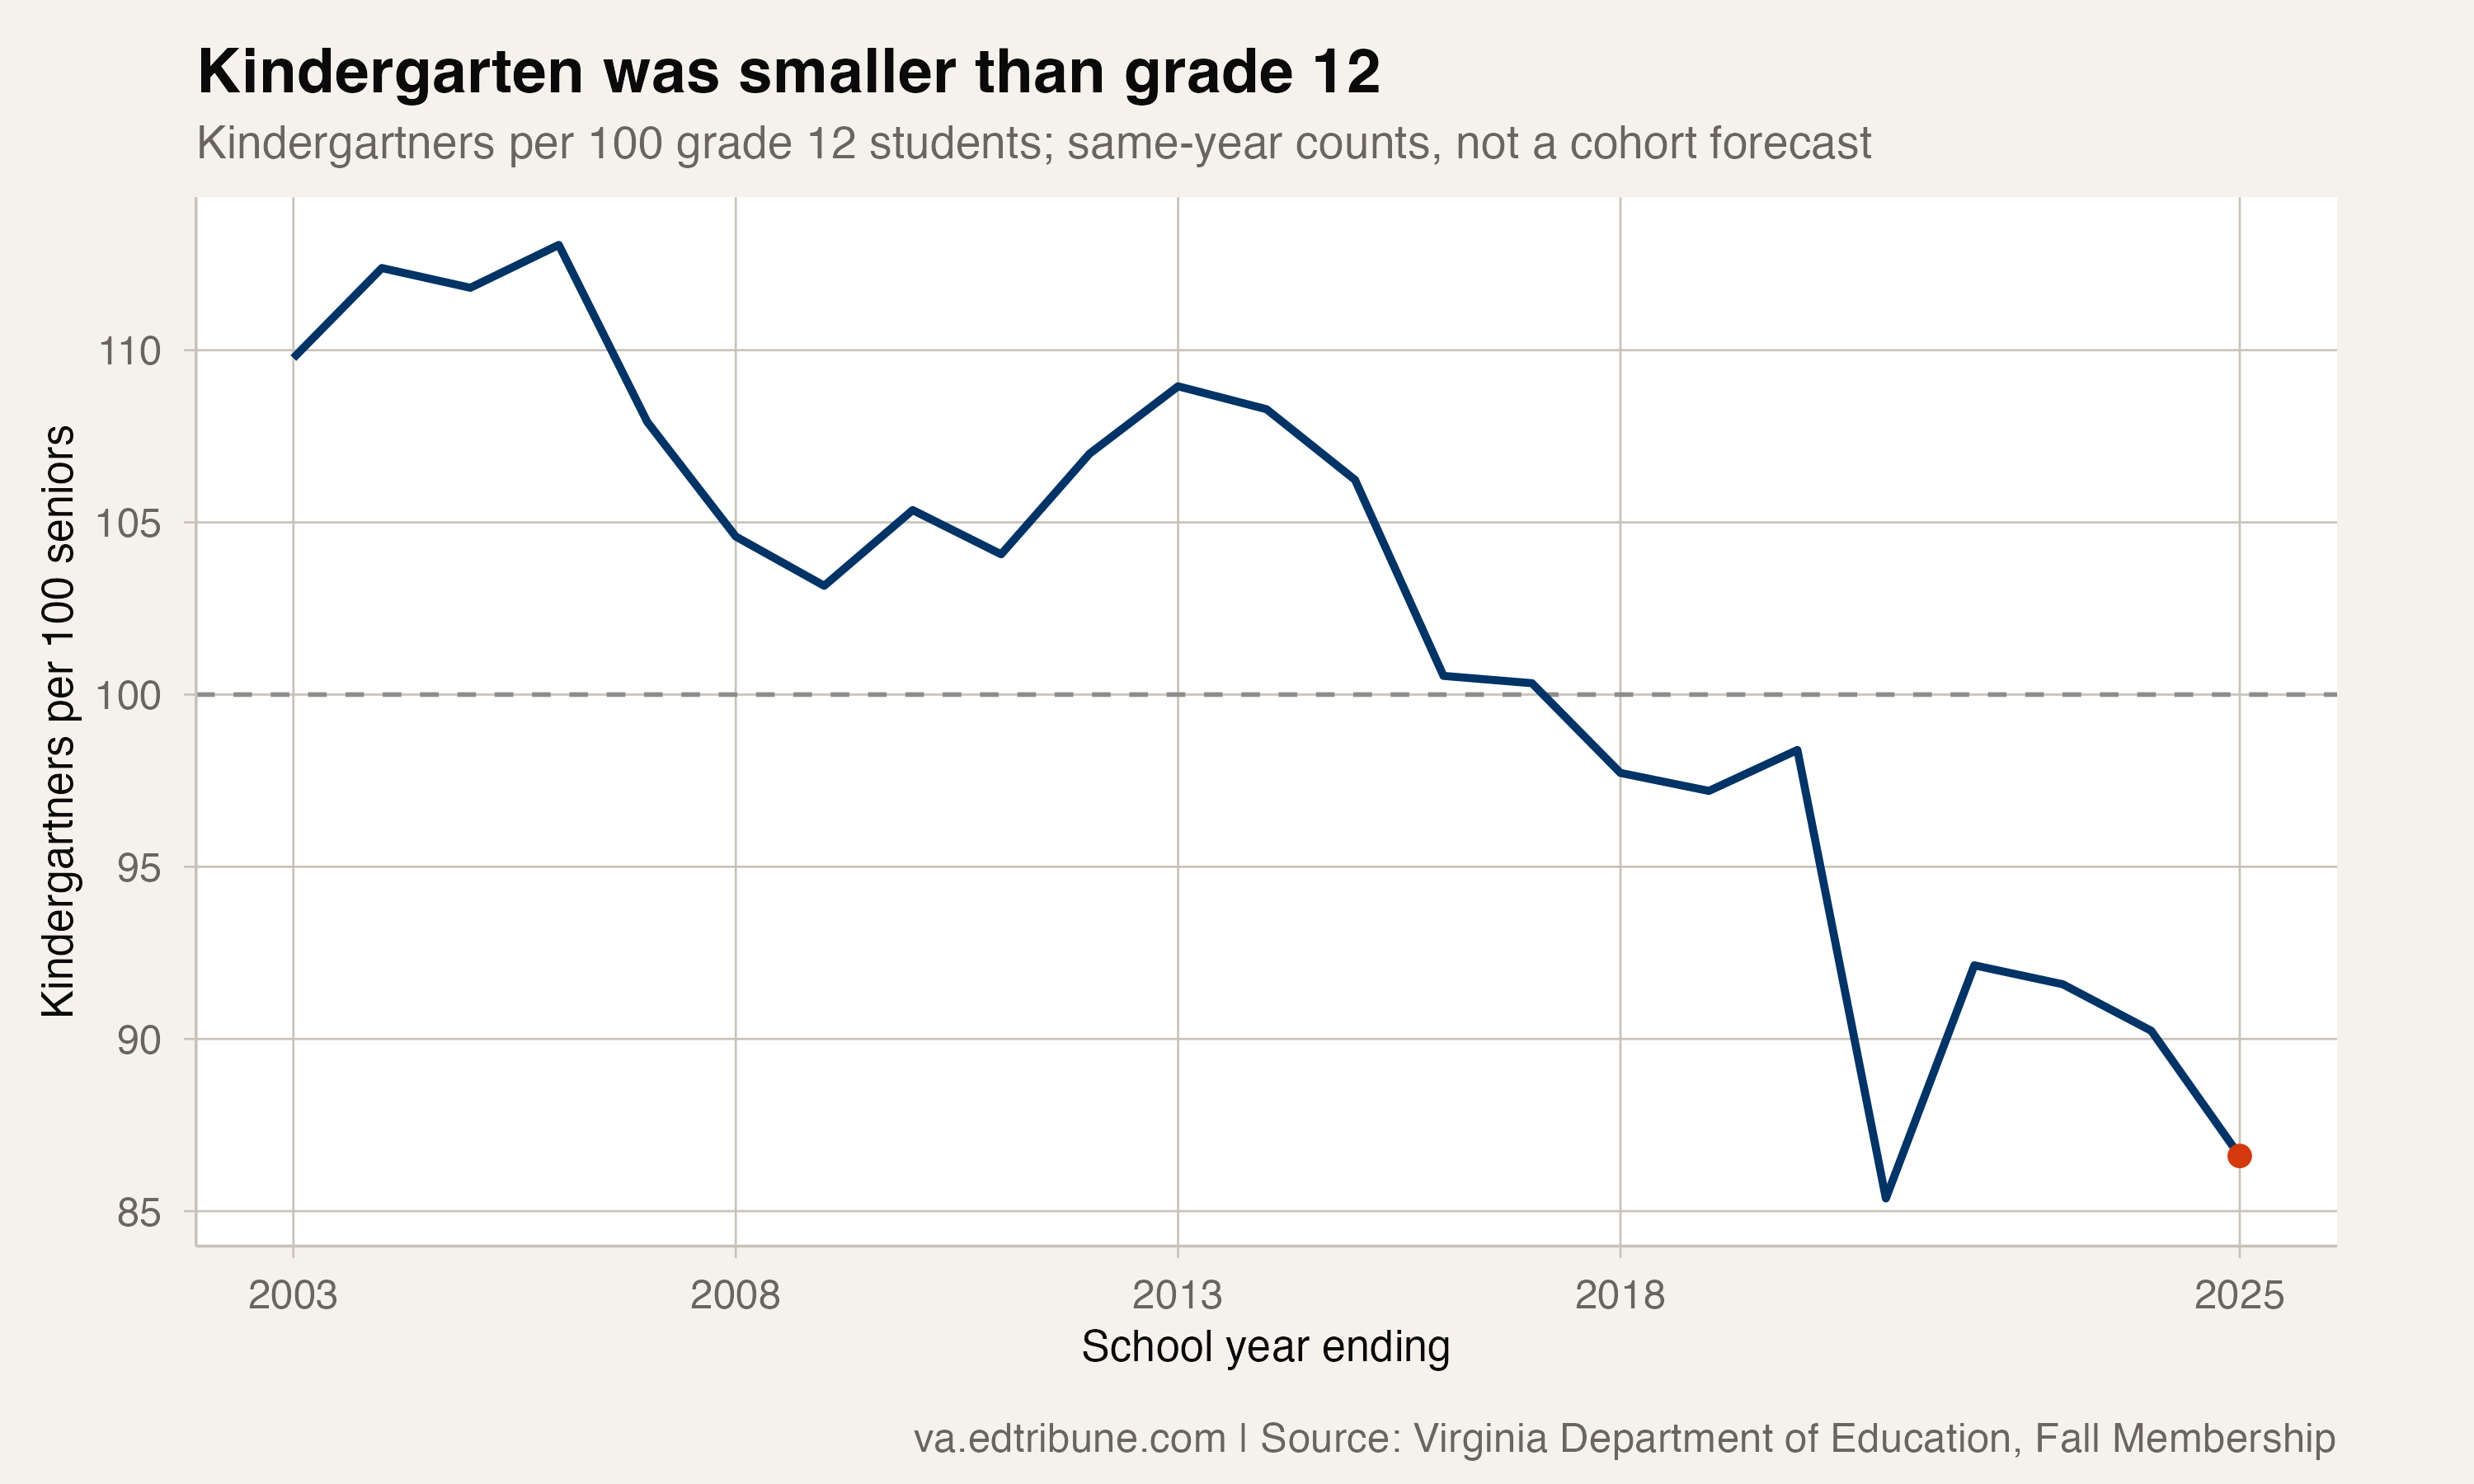
Those counts describe different groups of children. They do not predict the number of students who will enter or finish high school later. This historical overview follows the enrollment record through 2024-25; it does not describe live enrollment in the current school year.
Counts come from the Virginia Department of Education's Fall Membership records. Statewide totals include state-operated programs; division comparisons exclude them. The 2019-20 baseline uses the department's division-level count, which differs from its school-level file.
Correction, October 28, 2026: This article retains the corrected statewide and race counts from its earlier revision. It now removes unsupported explanations for enrollment changes and comparisons with private-school participation, and limits historical and grade comparisons to what the enrollment records establish.
Detailed code that reproduces the analysis and figures in this article is available exclusively to EdTribune subscribers.
Discussion
Sign in to join the discussion.
Loading comments...