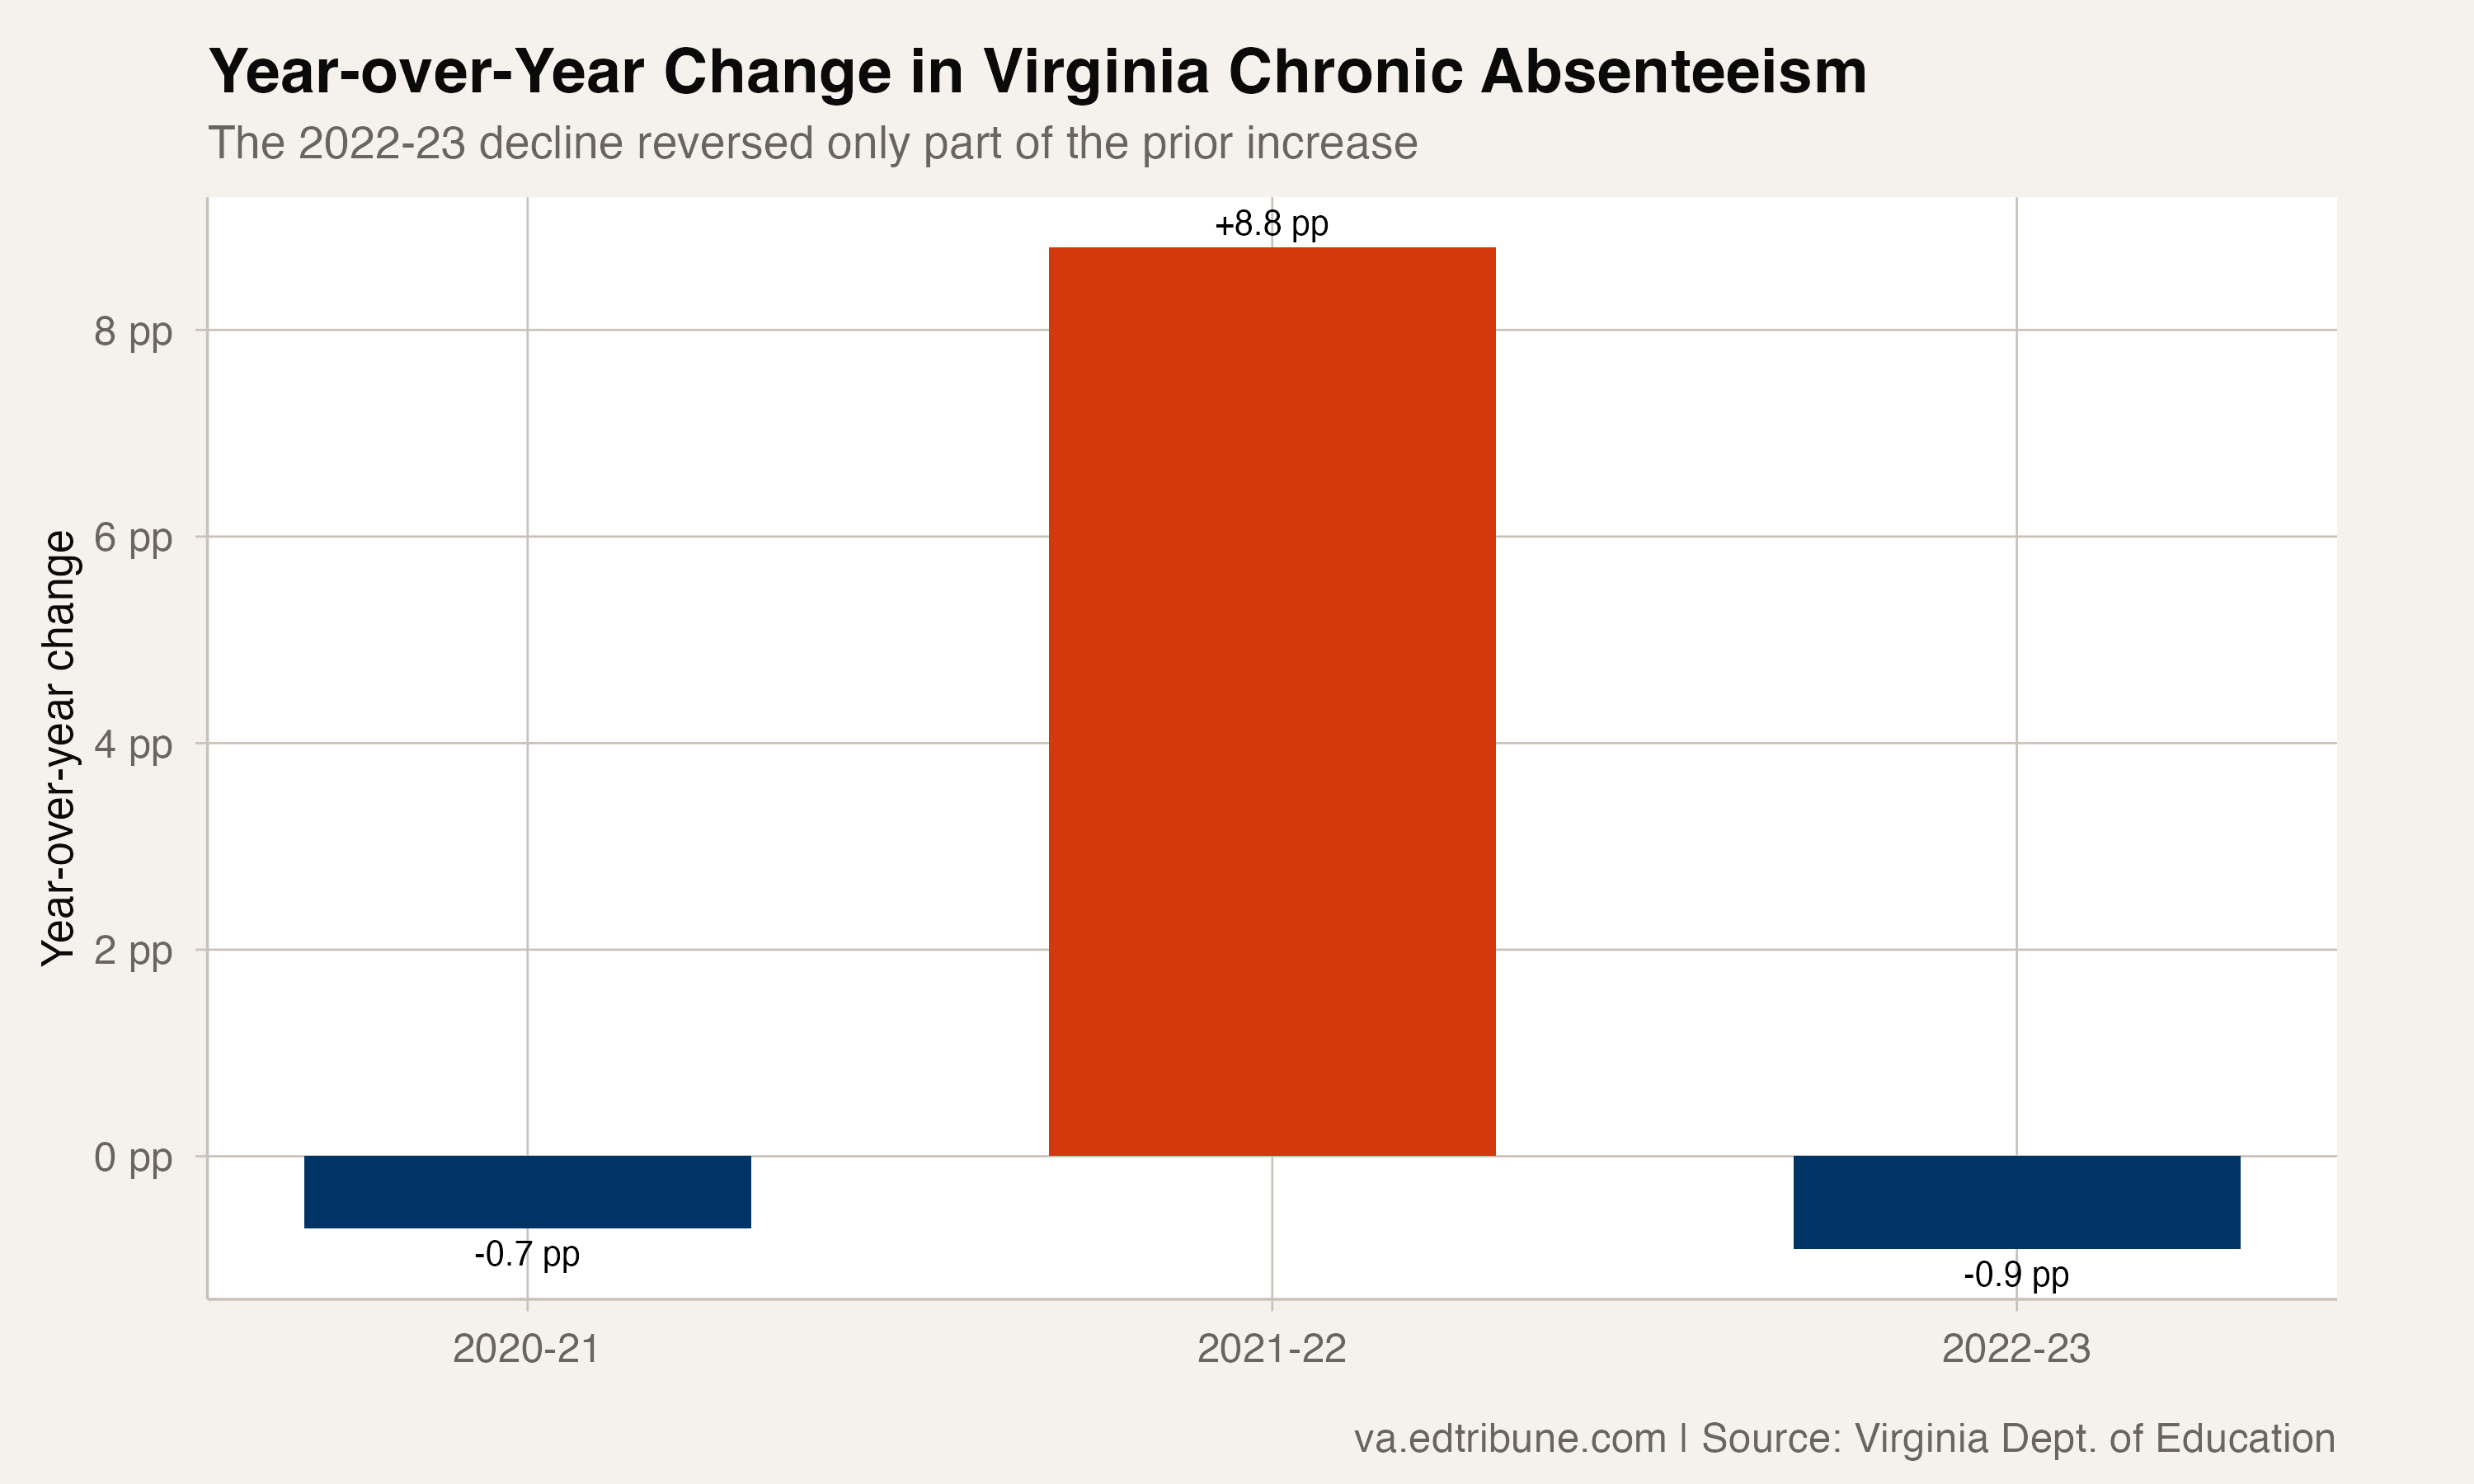
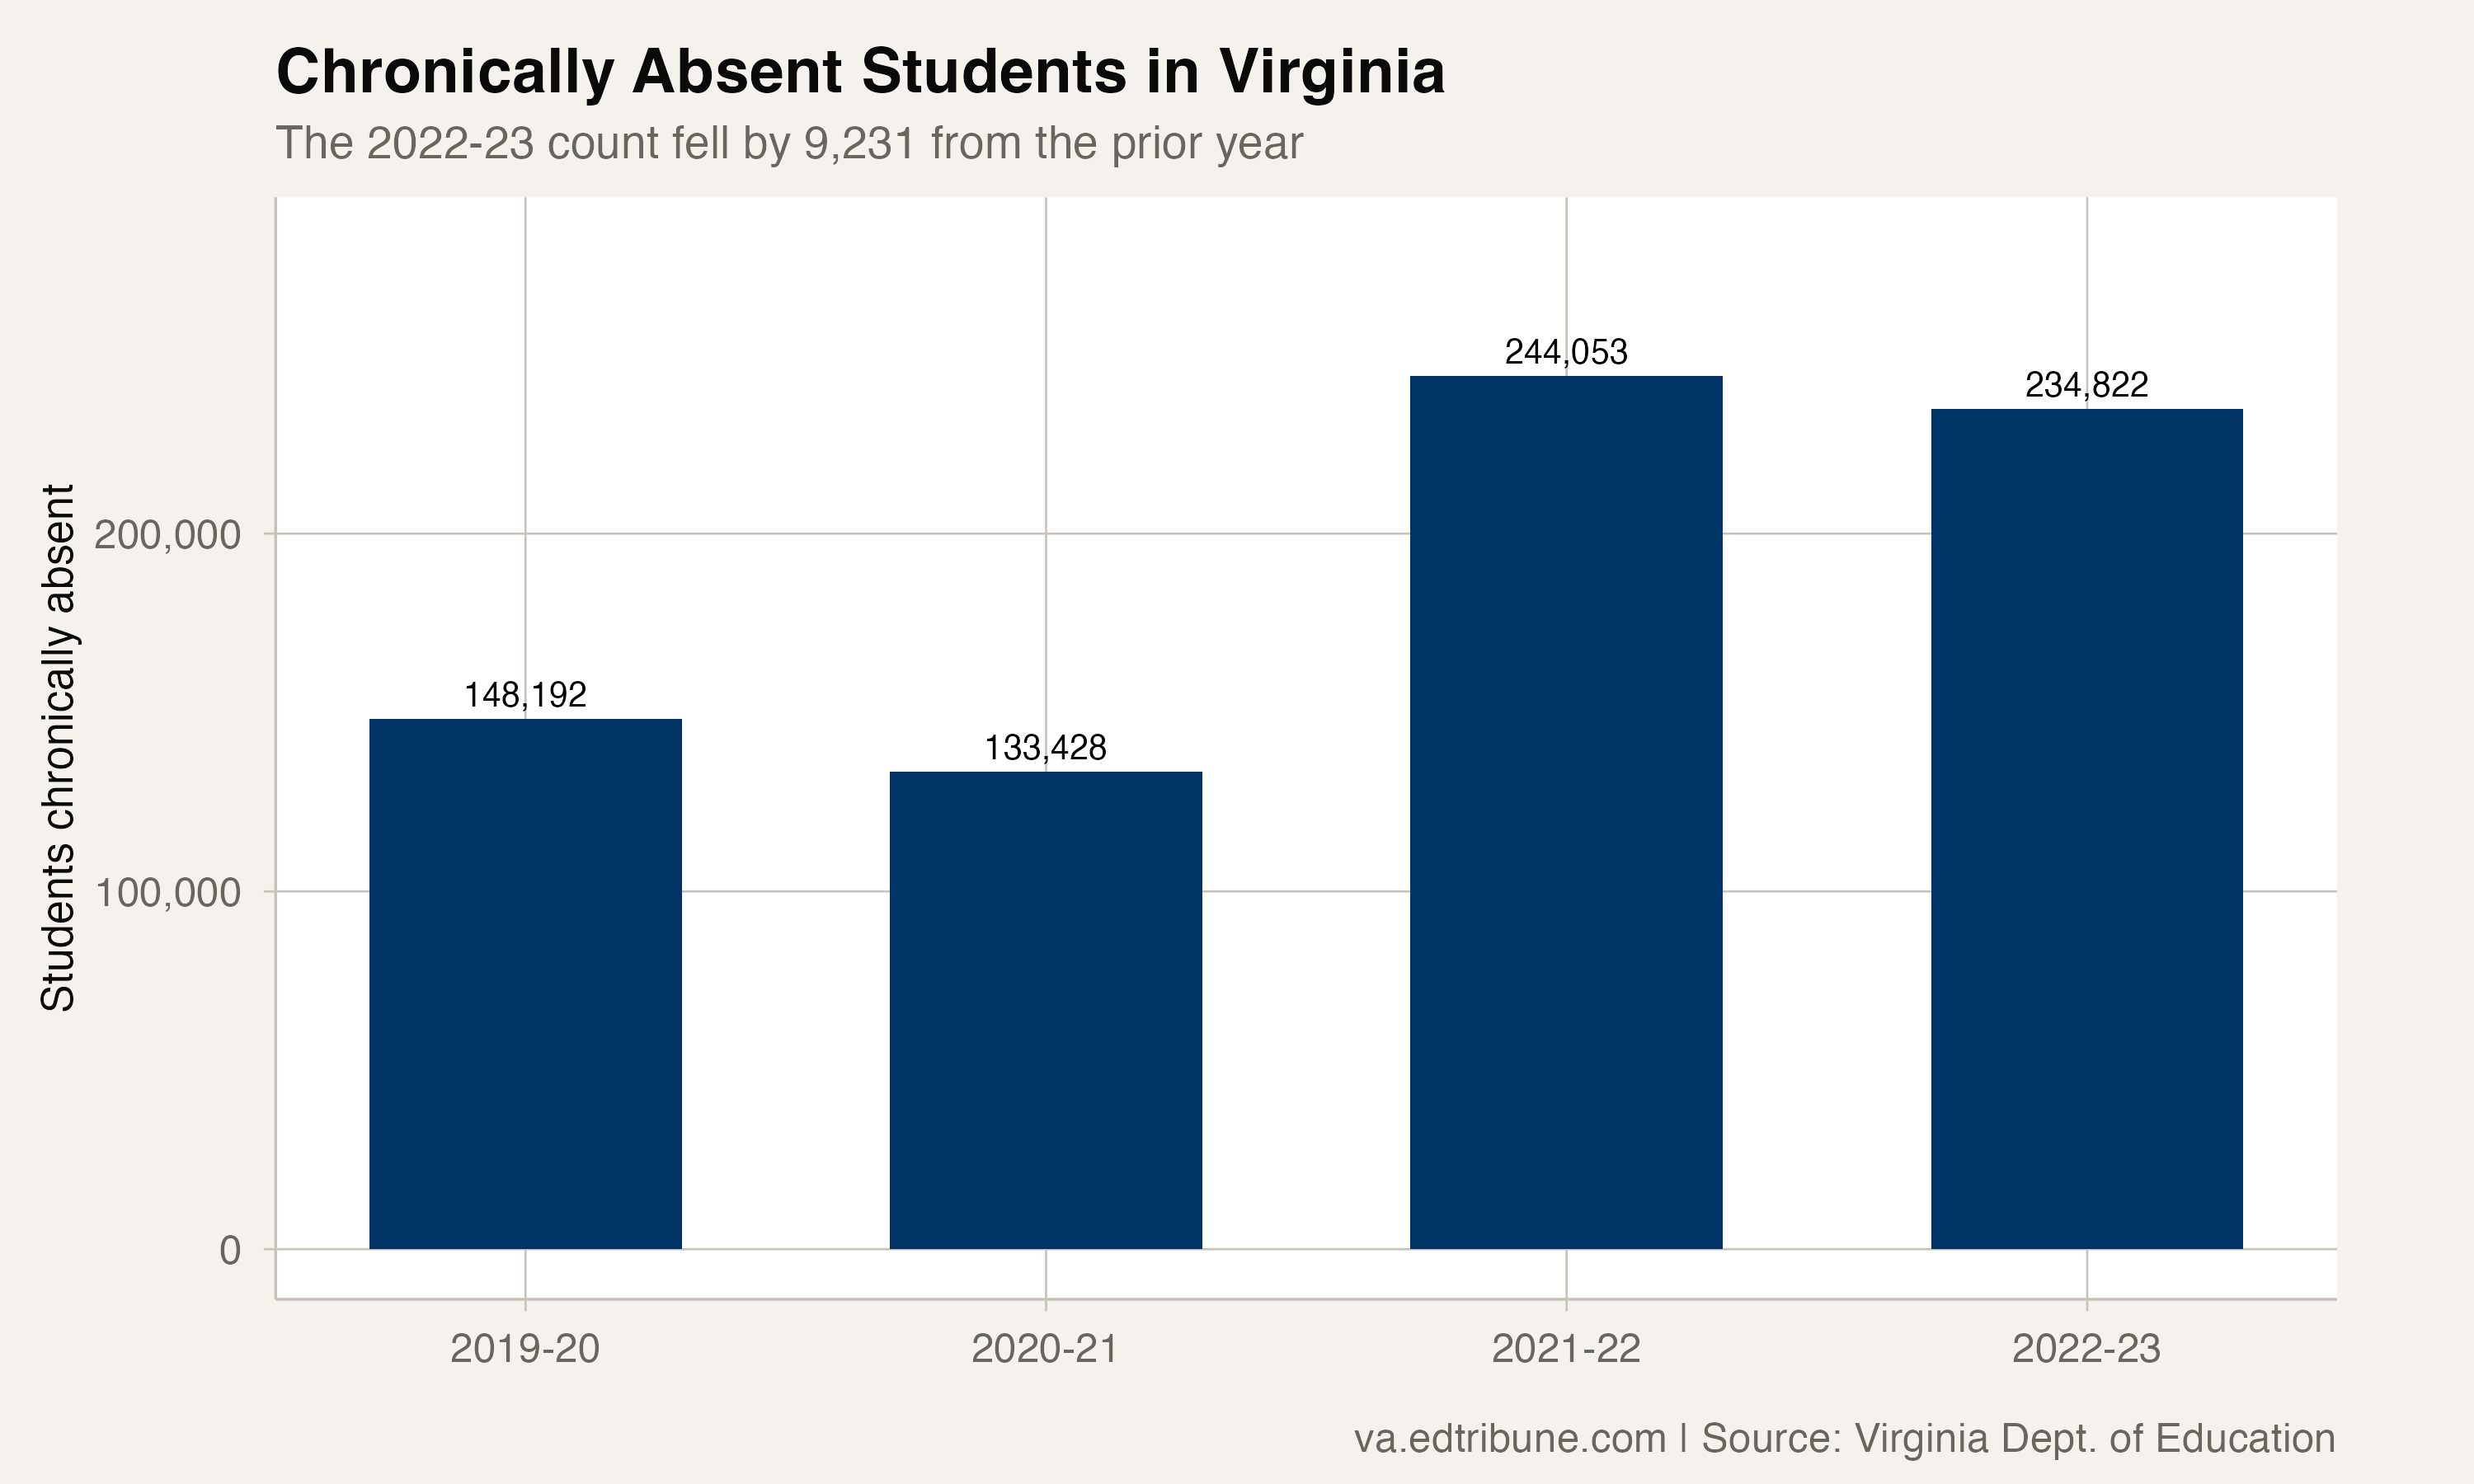
Virginia counted 236,104 chronically absent students in 2022-23, a rate of 19.3% under the Virginia Department of Education's published figures. That was 8,898 fewer students than in 2021-22, and the rate was 0.8 percentage points lower.
The decline reversed only 9.6% of the rise in the rate between 2019-20 and 2021-22. Across the four school years in the state's published absence data, the latest rate remained 7.5 points above the 2019-20 rate.
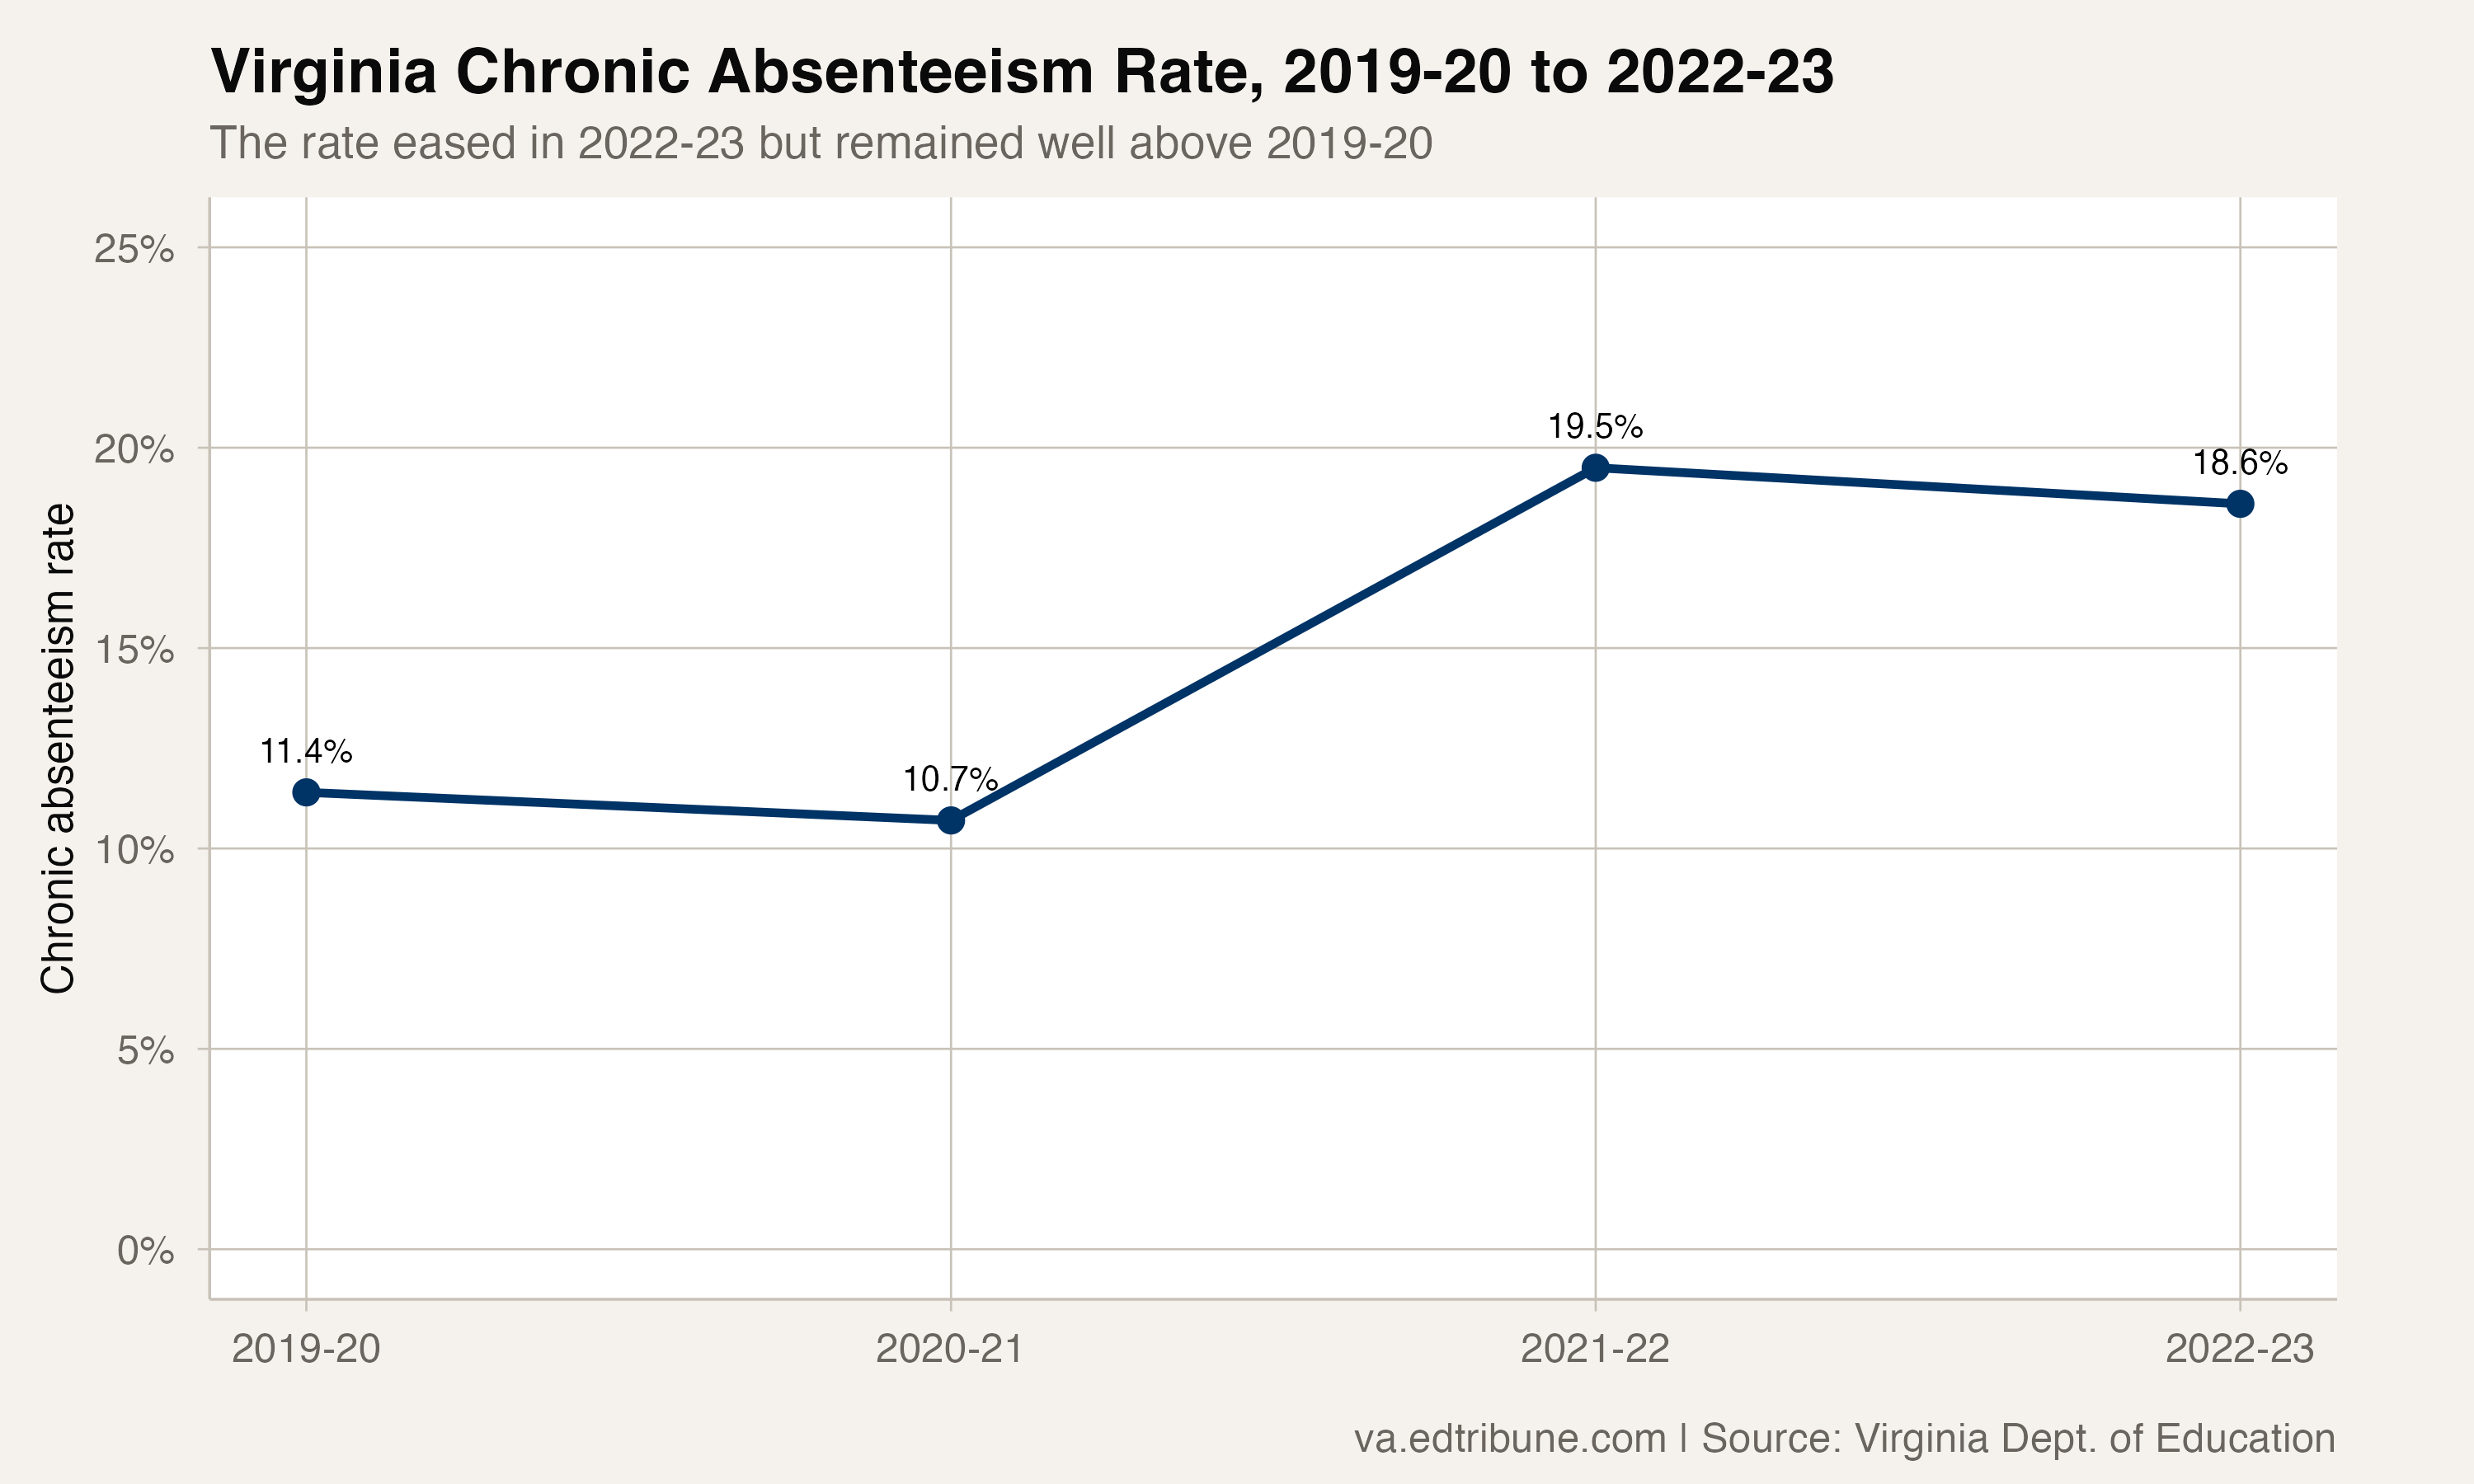
Four years of sharp movement
In 2019-20, Virginia recorded 148,713 chronically absent students, a rate of 11.8%. The count fell to 133,923 and the rate to 11.0% in 2020-21. It then rose to 245,002 students and 20.1% in 2021-22 before easing in 2022-23.
The state's files establish those counts and rates, but they do not identify the cause of the 2020-21 dip or the increase that followed. This article treats the changes as measured movements in the series, not as evidence that a particular policy or school format caused them.
The equity picture is worse than the average
The statewide rate masks large differences between student groups. Among students identified as homeless, 7,687 were chronically absent in 2022-23, a rate of 49.1%, about two and a half times the statewide rate. The rate was 27.5% among economically disadvantaged students, 25.4% among students with disabilities and 24.5% among Hispanic students.
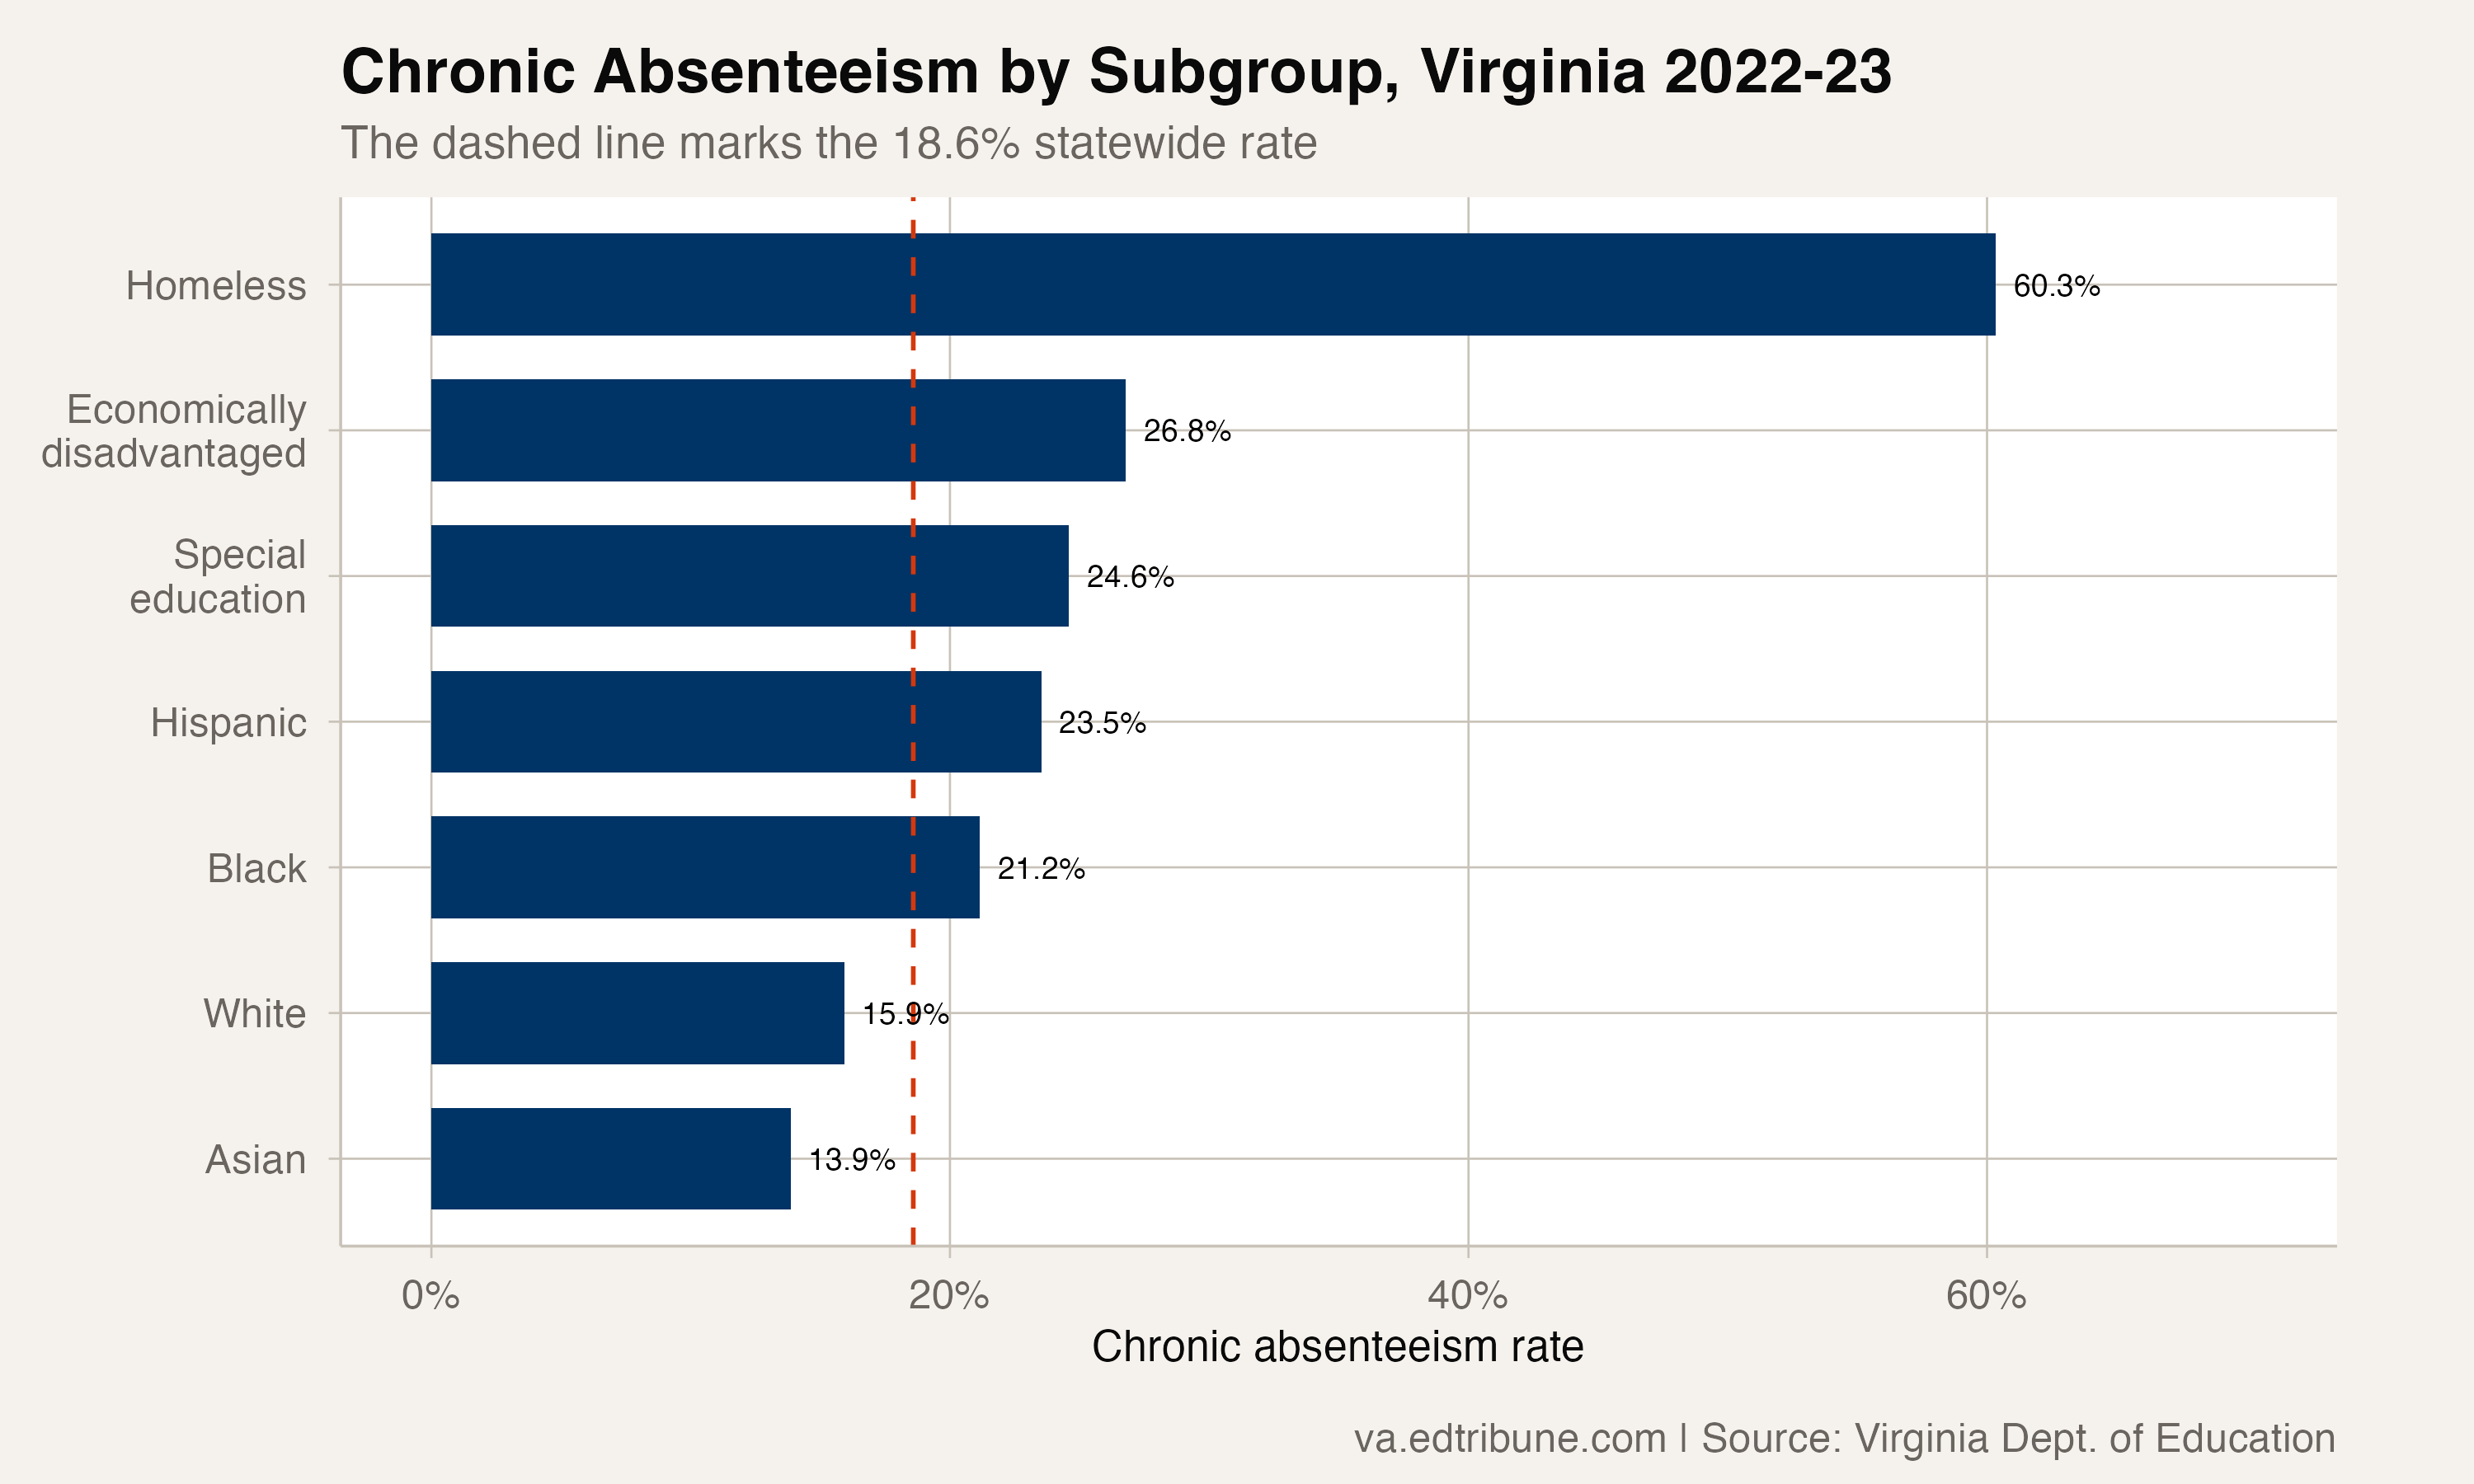
Asian students had the lowest rate among the highlighted groups at 14.4%, followed by white students at 16.5%. The rate for Black students was 22.5%, leaving a 6.0-point Black-white gap. That gap was 3.6 points in 2019-20.
236,104 students, concentrated in a few places
Fairfax County↗ET accounted for 30,123 chronically absent students in 2022-23, 12.8% of the state total. Prince William County↗ET had 17,836, and Loudoun County had 15,284. The ten divisions with the largest counts together had 118,793 chronically absent students, or 50.3% of the statewide count.
Rate rankings show a different map. Petersburg had Virginia's highest division rate at 43.1%. Greensville County ranked fifth at 34.7%, and Manassas Park ranked seventh at 33.2%. Those three divisions together accounted for 3,406 chronically absent students, or 1.4% of the statewide count.
The distinction is arithmetic: large divisions dominate the statewide total, while several smaller divisions carry the highest rates. The state's data show both patterns, but they do not establish which local conditions produced them.
Correction (October 3, 2026): An earlier version of this article reported a 2022-23 statewide rate of 18.6% and a count of 234,822. The state data used earlier added up school and division rows in which counts the state had suppressed for privacy were treated as zero, and it divided those counts by a separate enrollment total. Both understated the figures. The article now uses the Virginia Department of Education's own published statewide and division counts and rates: 236,104 chronically absent students and a rate of 19.3%, a decline of 8,898 from 2021-22 rather than 9,231. The homeless rate is 49.1%, not 60.3%, and every other subgroup rate, division count, share and ranking has been updated. The direction of every finding is unchanged.
Detailed code that reproduces the analysis and figures in this article is available exclusively to EdTribune subscribers.
Discussion
Sign in to join the discussion.
Loading comments...