Correction, July 28, 2026: An earlier version of this article listed Radford City among the divisions whose chronic absenteeism improved. Radford's published rate fell because a large, low-absence virtual school joined the division's roster in the final year of the comparison, while the number of chronically absent students in the division rose and every one of its physical schools got worse. That passage has been rewritten, and the article now discloses the enrollment-composition effects behind two of the divisions at or below baseline.
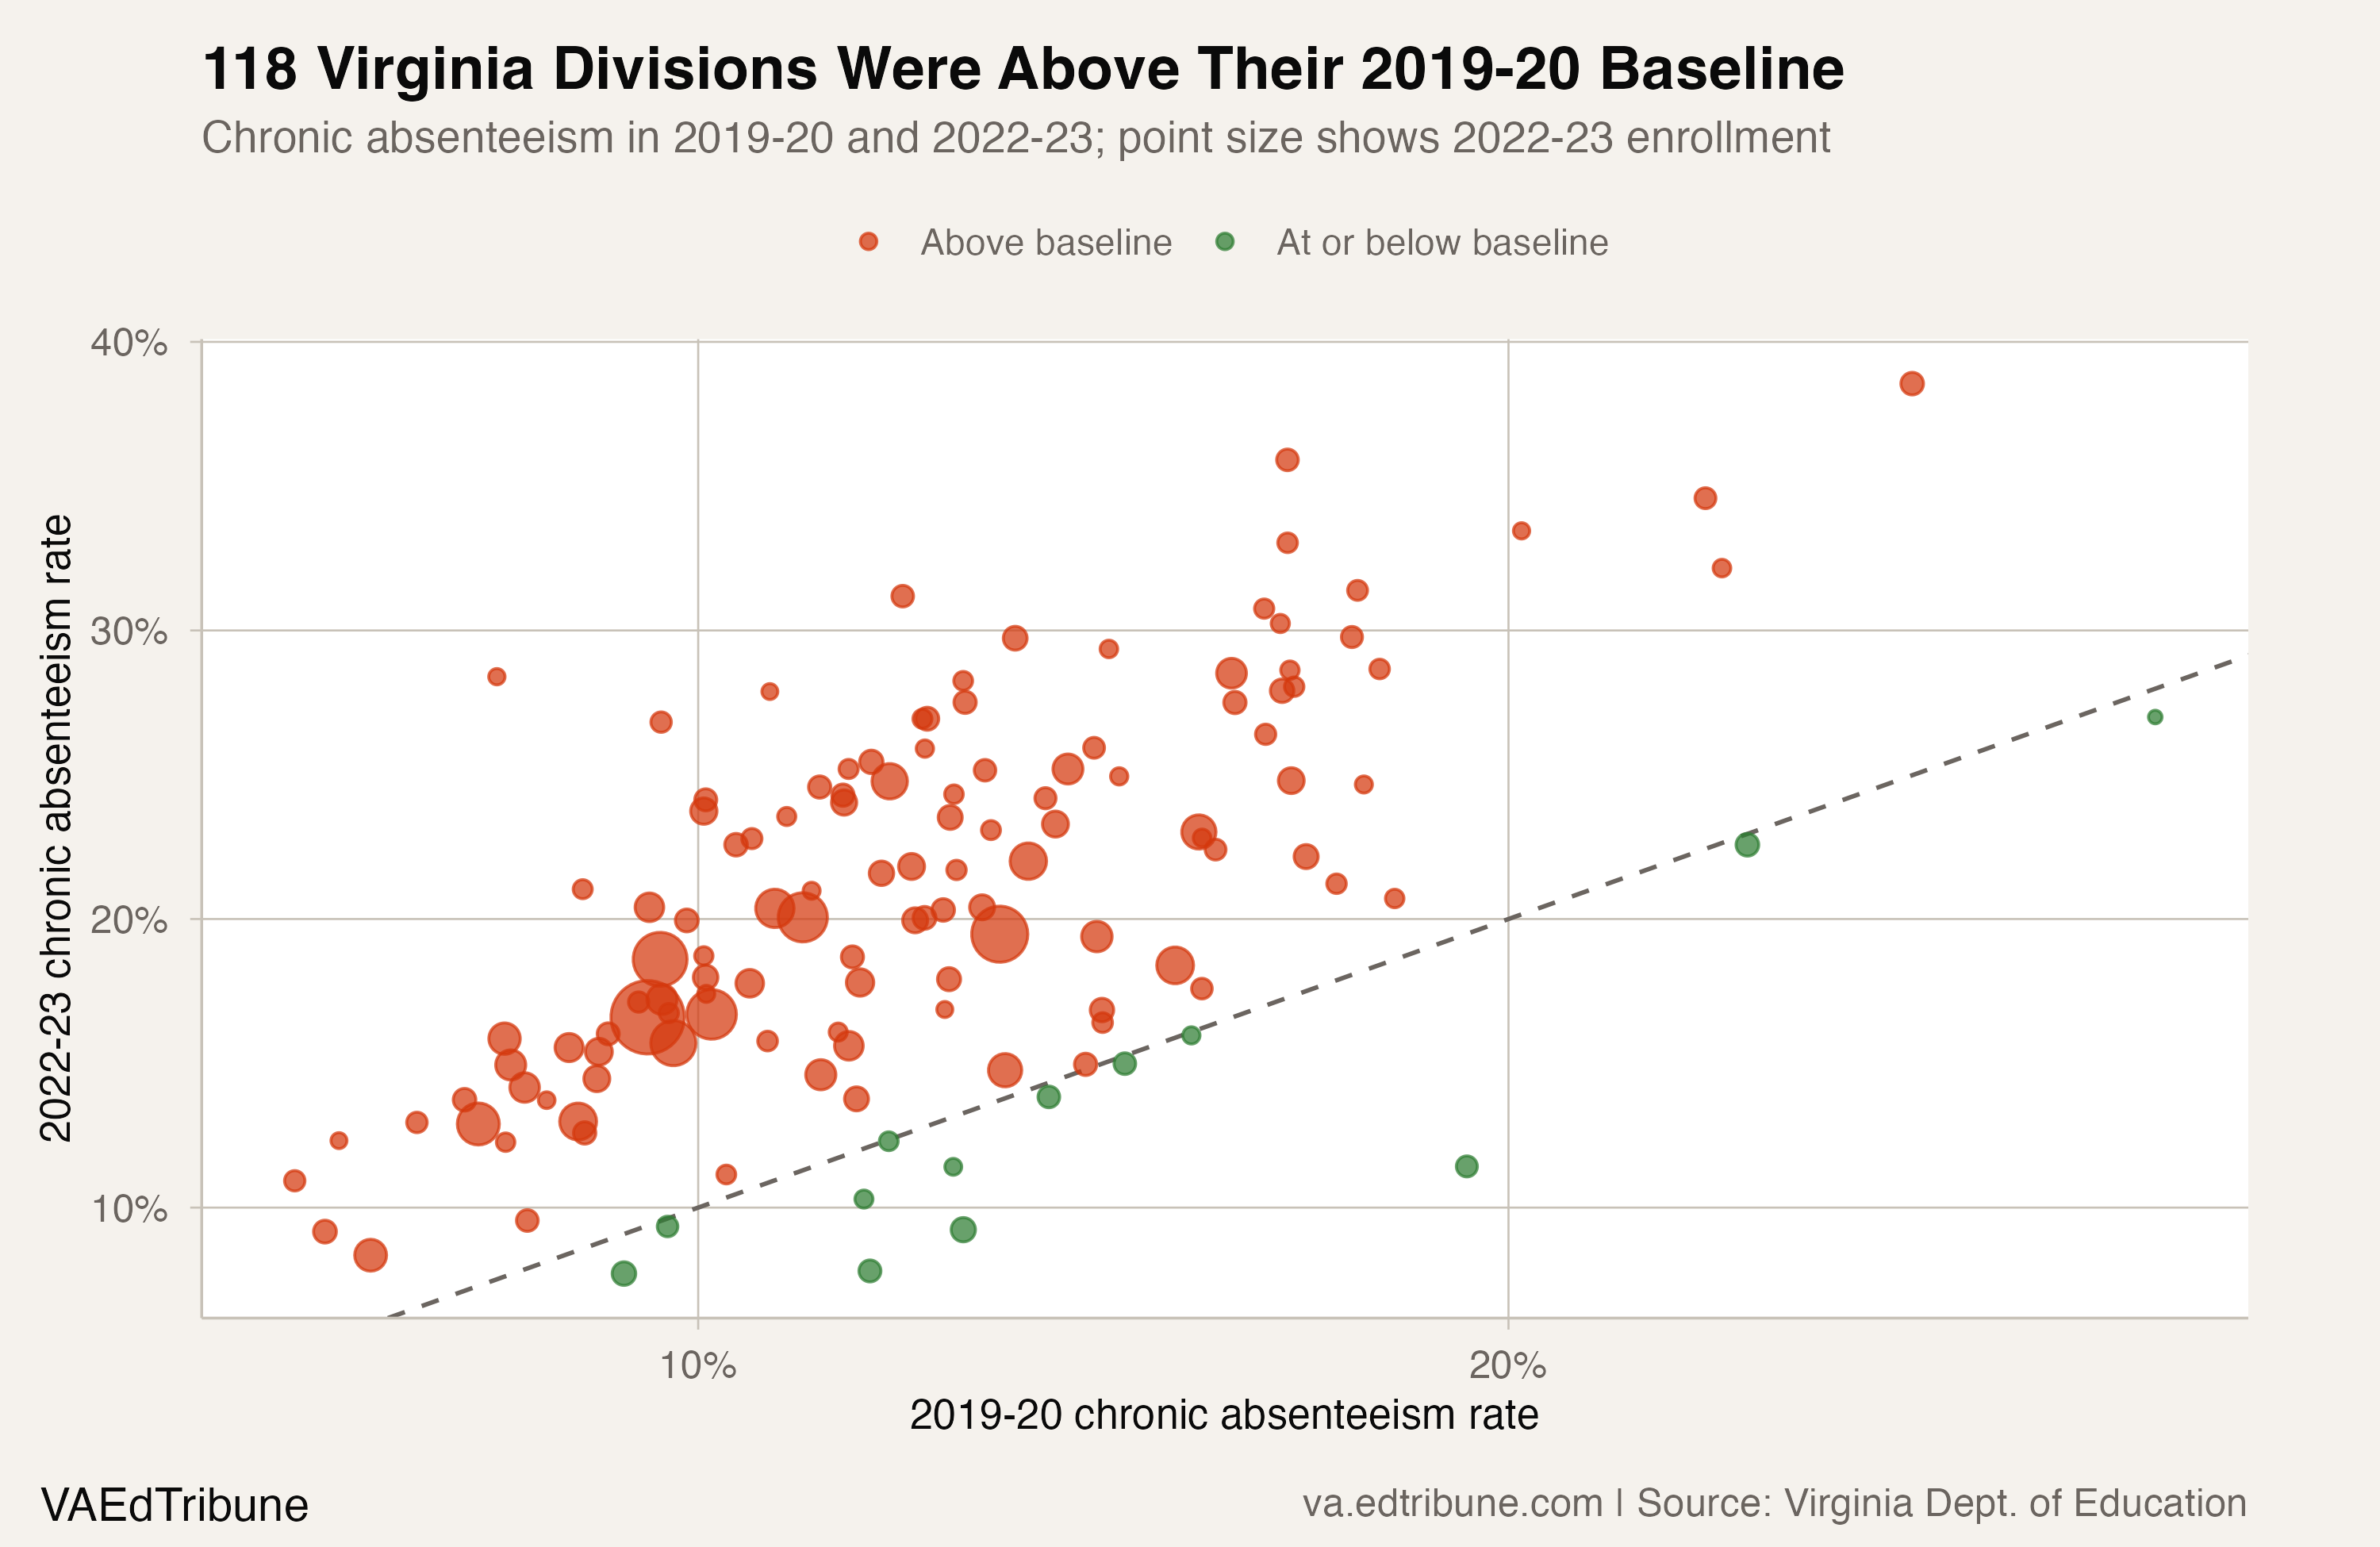
Virginia's published chronic-absenteeism data covers four school years, from 2019-20 through 2022-23. Among the 130 divisions that can be compared at both ends of that window, only 12 had a 2022-23 rate at or below their 2019-20 rate.
The other 118 divisions were above the baseline. Put another way, 9.2% had returned to or improved on that first available rate.
The student distribution makes the contrast sharper. The 12 divisions at or below baseline enrolled 35,285 students in 2022-23, just 2.8% of the enrollment represented in the endpoint comparison.
Two of those 12 divisions, Radford City and Giles County, sit in that group partly because their enrollment bases grew by 125% and 45% between the two endpoints as schools were added to their rosters. On stable enrollment bases the count at or below baseline would be 10.
What “recovery” can and cannot mean here
This analysis uses “at or below baseline” as a narrow endpoint test, comparing the rates the Virginia Department of Education published for each division. It does not call 2019-20 a clean pre-pandemic benchmark, because the state's published series starts that year and the pandemic closed schools that spring. It also makes no claims about years after 2022-23, the last year in the published series. Alleghany County is left out of the comparison: it merged with Covington City in 2022-23, so its endpoints describe two different school systems.
Among the 12 divisions at or below baseline:
Lee County↗ET moved from 21.2% to 12.4%, an 8.8-point reduction, the largest in the group.
Wise County↗ET moved from 13.9% to 10.2%, a 3.7-point reduction.
Louisa County↗ET moved from 9.5% to 8.0%, a 1.5-point reduction.
Radford City is not on that list, and the reason is worth stating plainly. Its published rate did fall, from 12.4% in 2019-20 to 8.0% in 2022-23. Over the same period the number of chronically absent students in the division rose from 199 to 287. What moved was the base. Radford City Virtual, a school with a published chronic-absenteeism rate of 0.3%, appeared on the division's roster for the first time in 2022-23, the same year the division's enrollment reached 3,690 students, up from 1,642 in 2019-20.
Each of Radford's four physical schools ended the window worse than it started: Belle Heth Elementary went from 7.0% to 13.8%, John N. Dalton Intermediate from 14.1% to 22.9%, McHarg Elementary from 10.2% to 19.4%, and Radford High from 18.3% to 20.4%.
The endpoint test does not explain those changes. It identifies where the reported rate moved, not why.
The typical division remained well above baseline
The median division's chronic-absenteeism rate increased about 8 percentage points from 2019-20 to 2022-23. Forty-seven divisions recorded increases from five through 10 points.
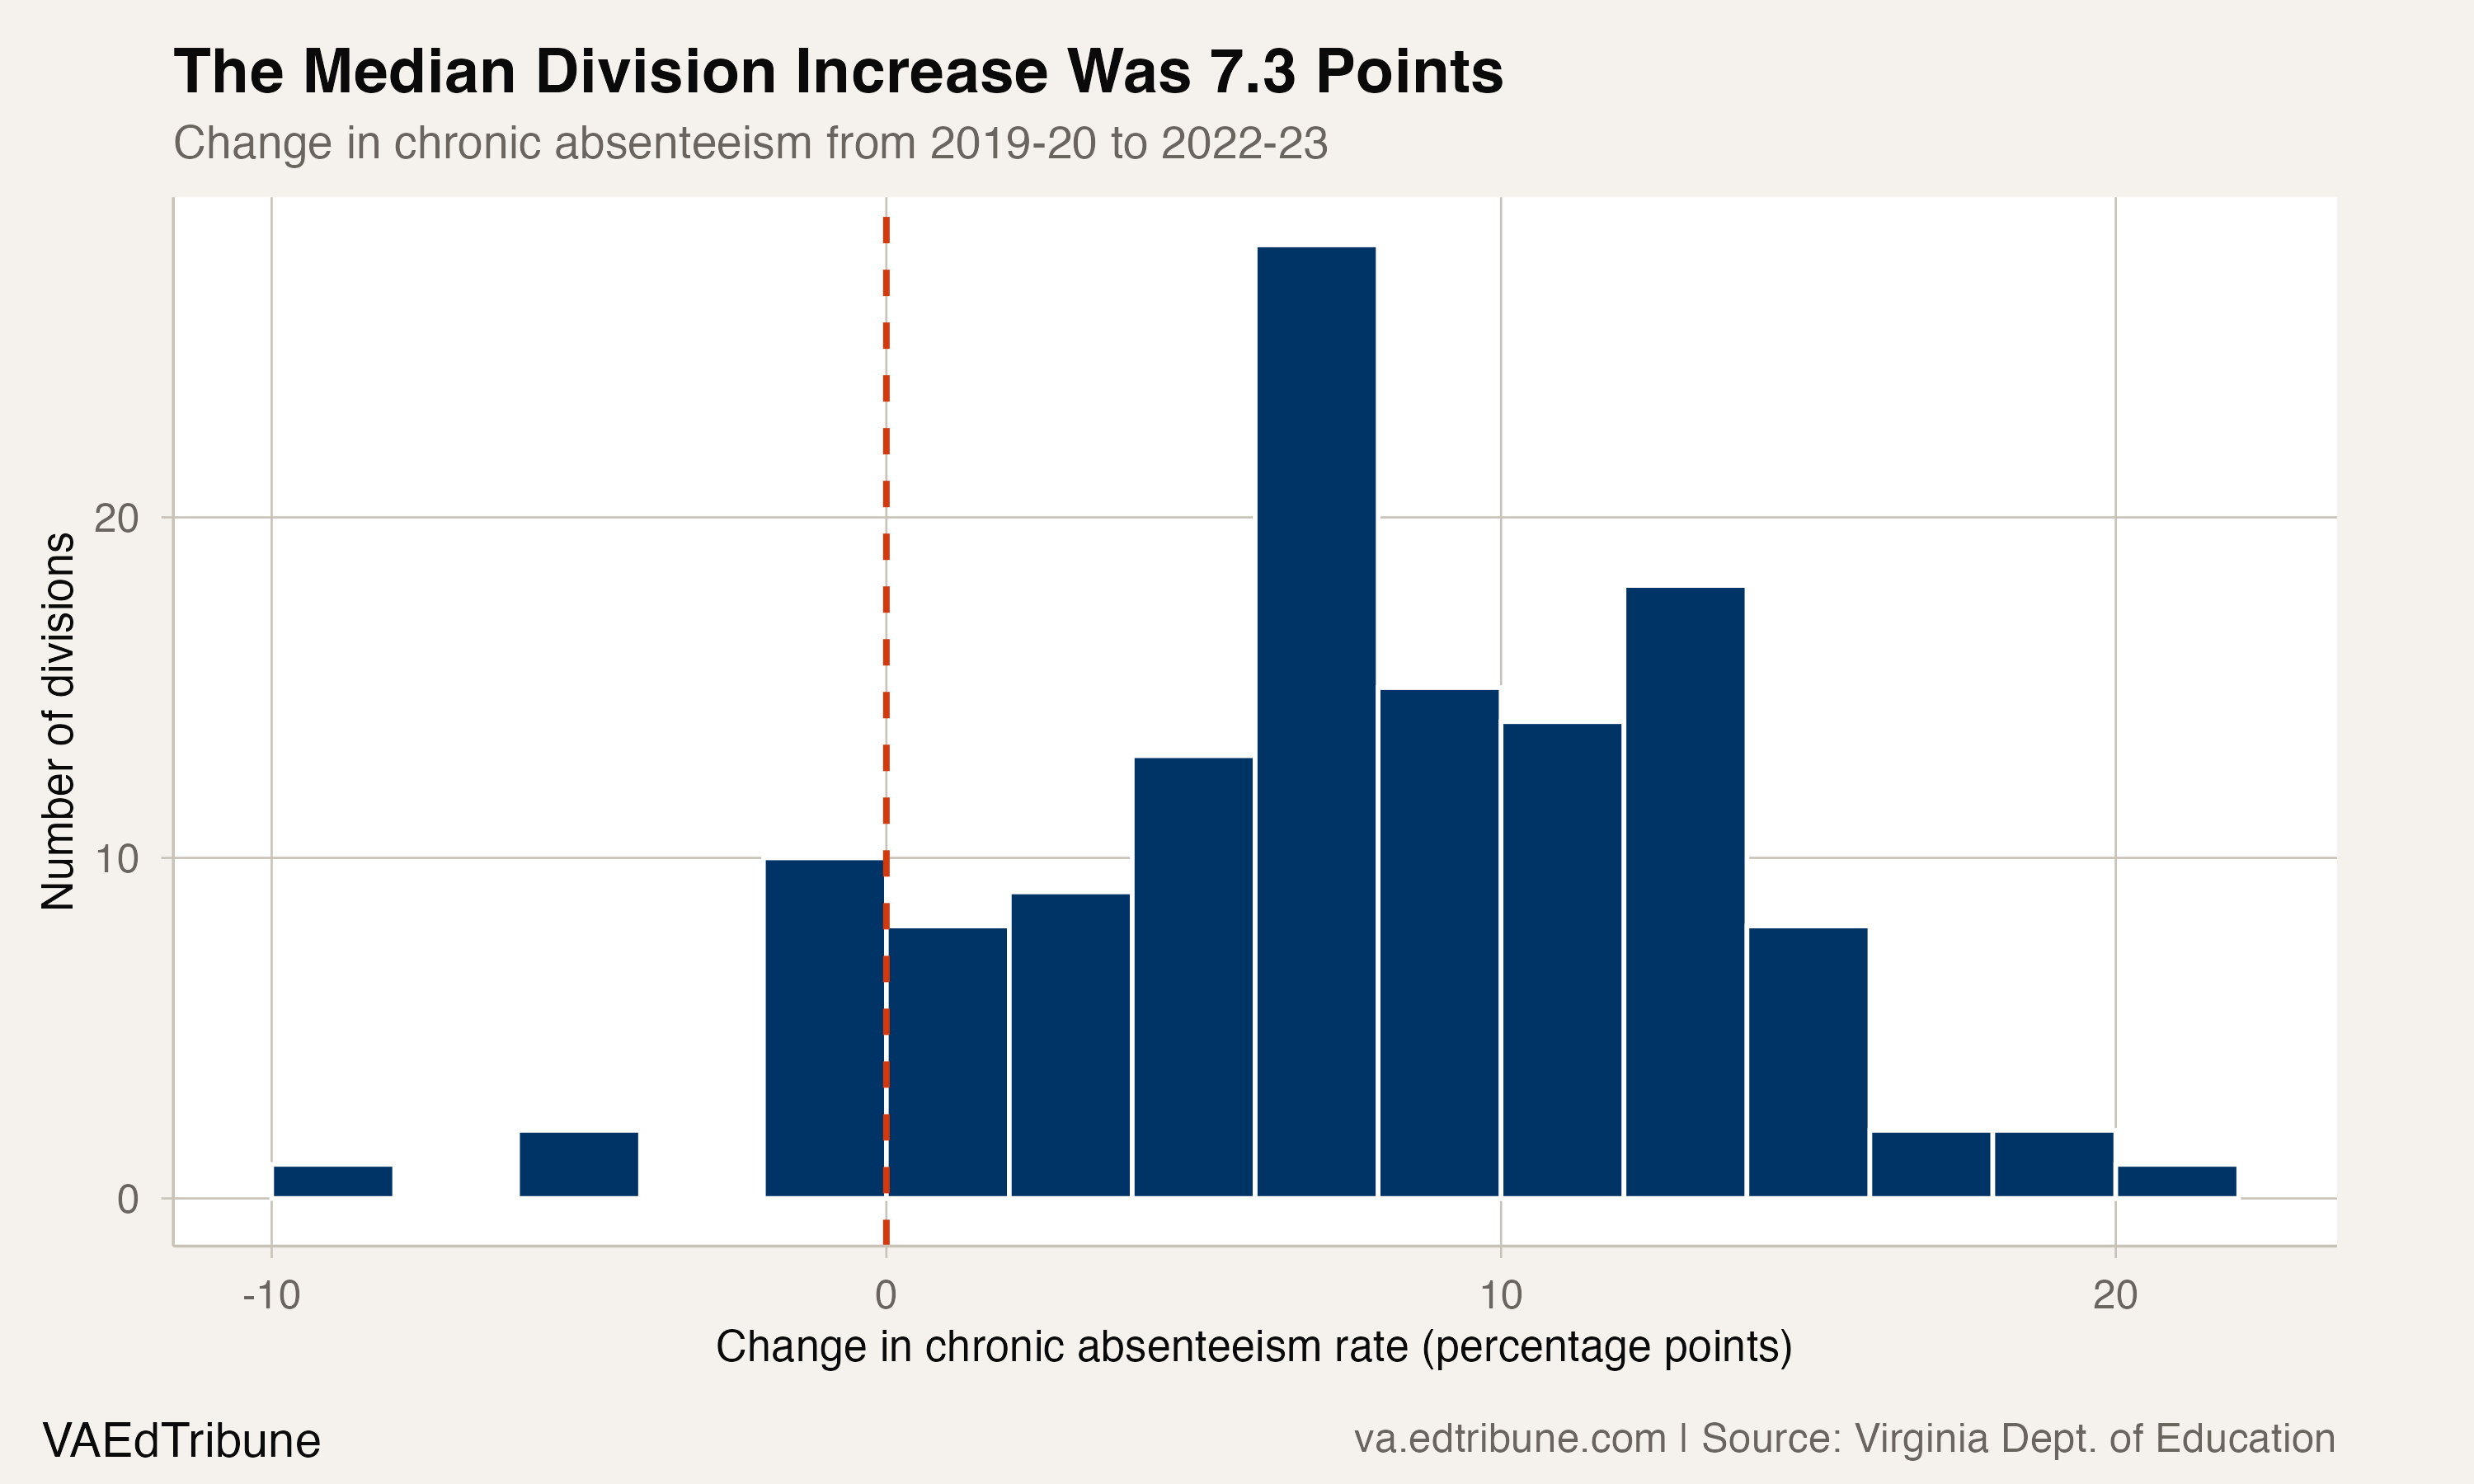
Among the 118 divisions above baseline, the average gap was 9.2 points and the median gap was 8.5 points.
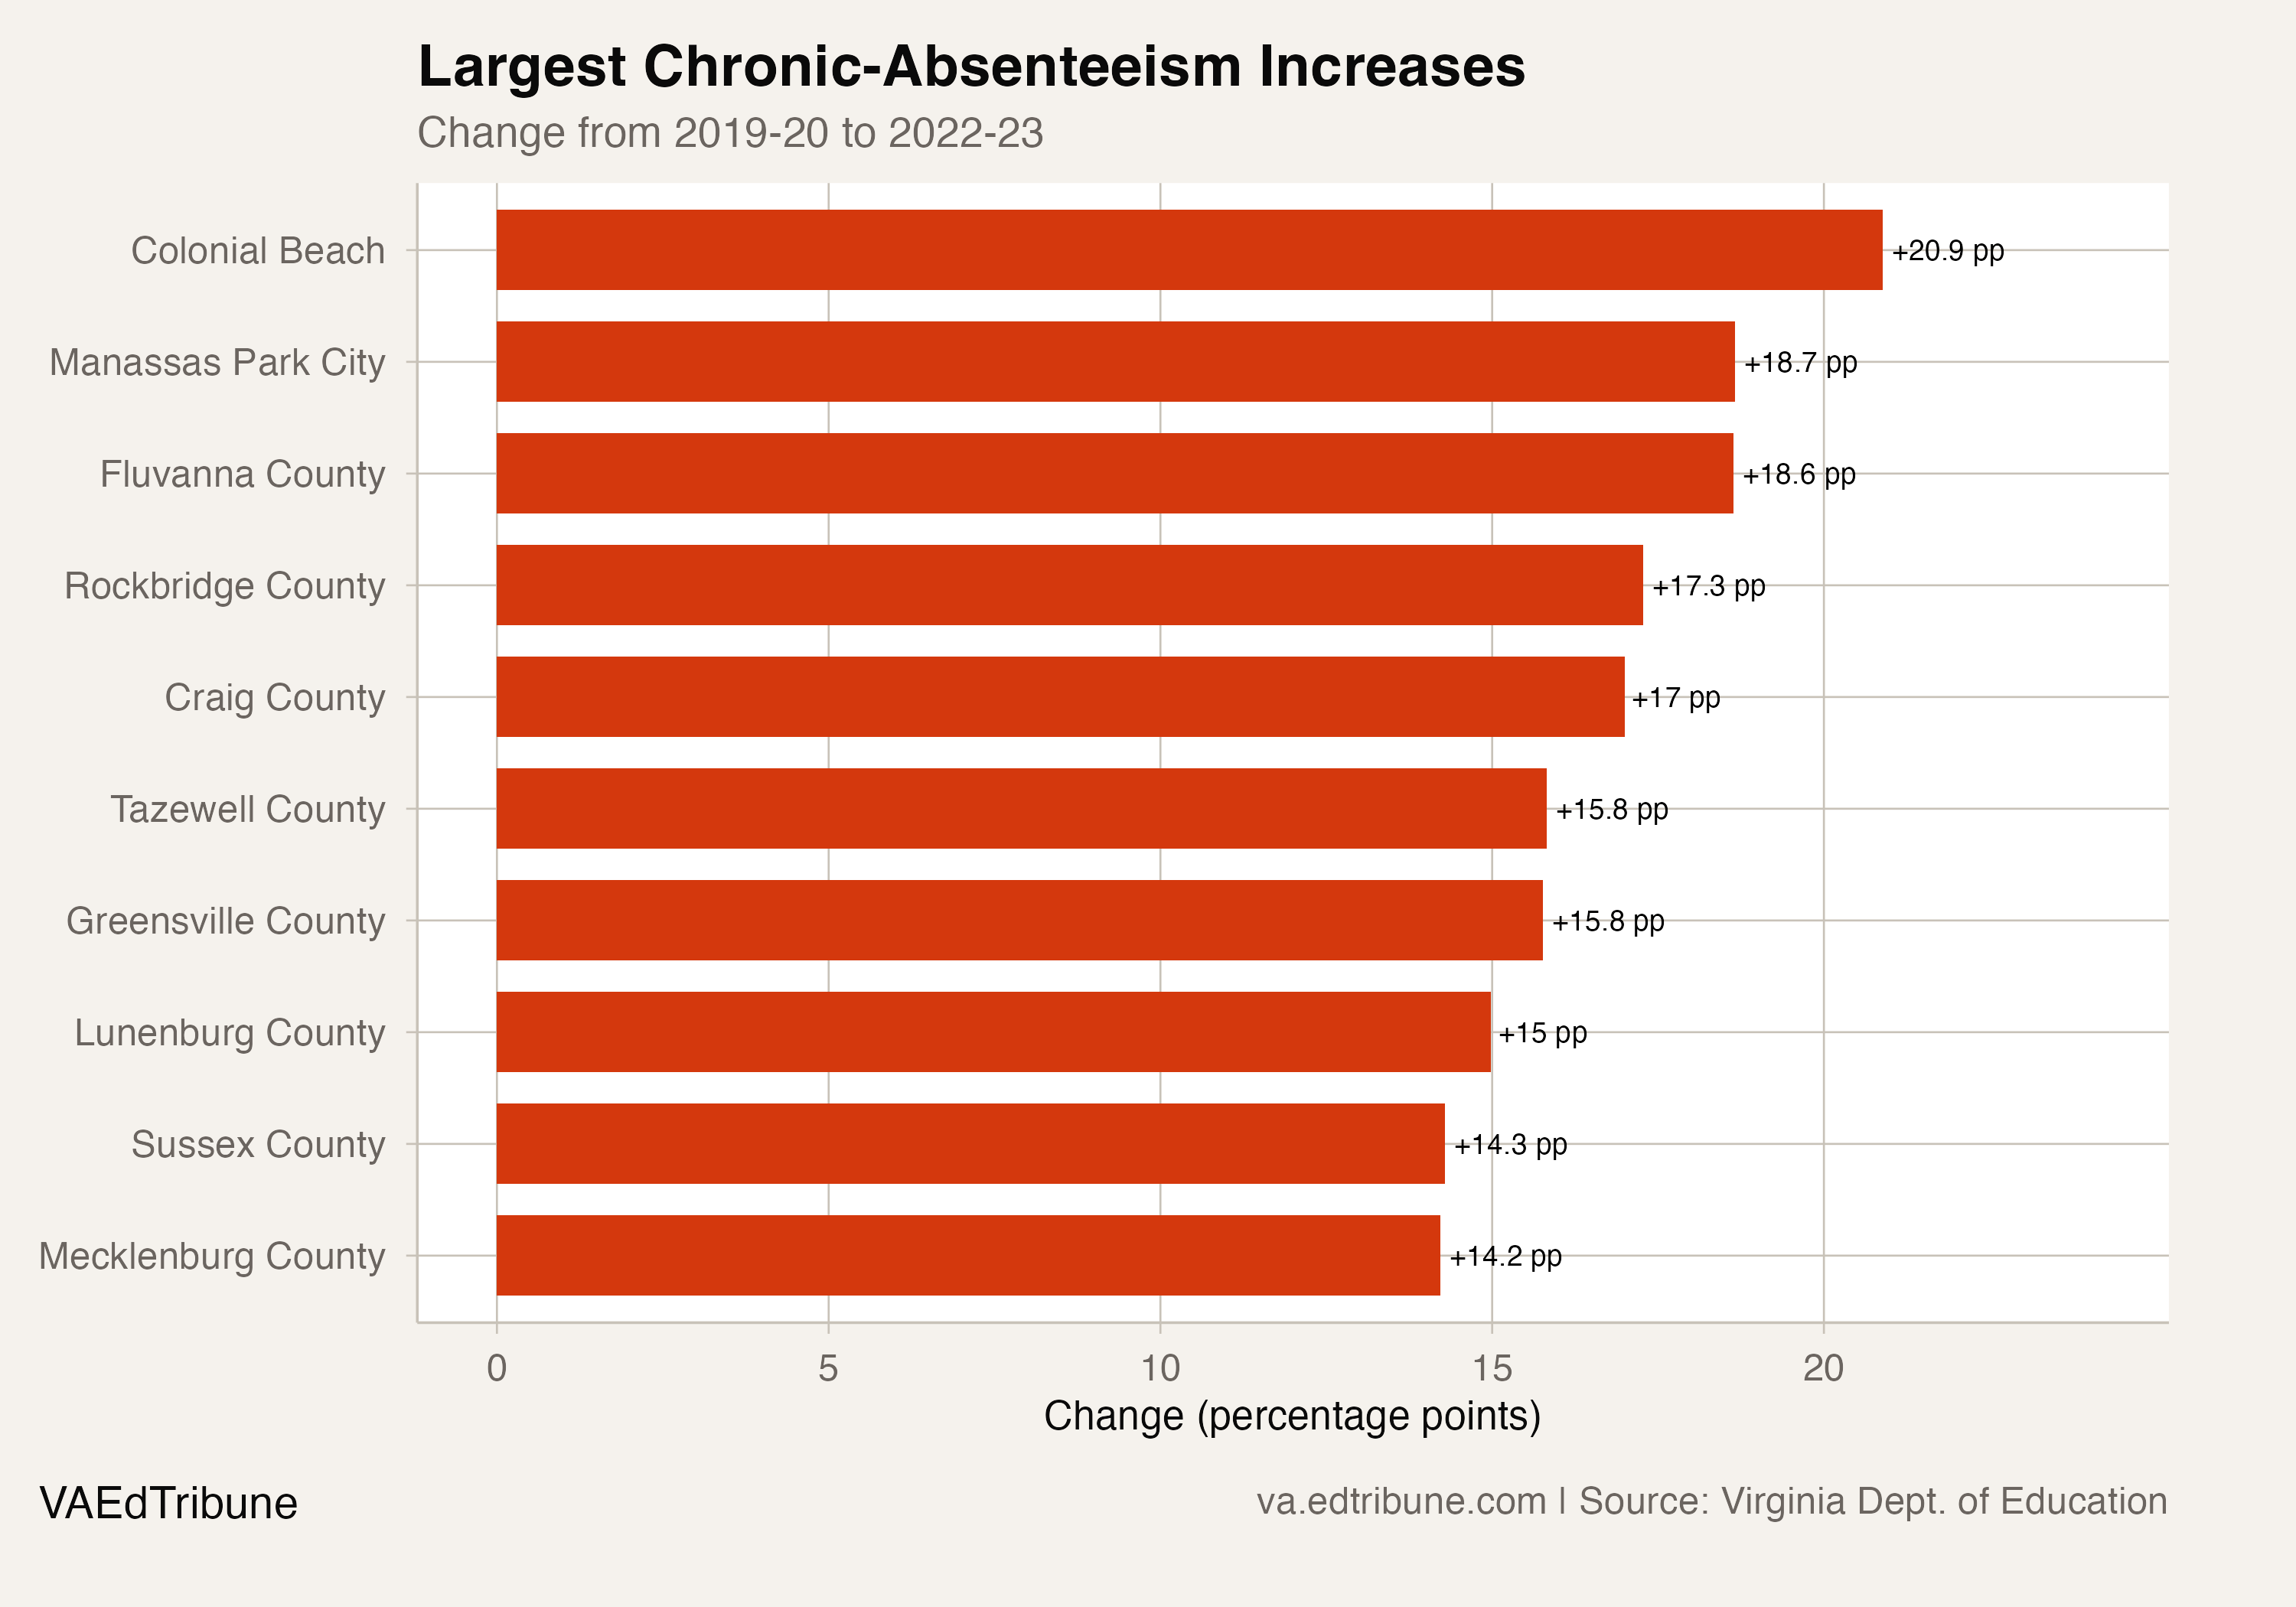
The four largest increases were:
Colonial Beach: 8.0% to 30.1%, up 22.1 points.
Manassas Park City↗ET: 13.1% to 33.2%, up 20.1 points.
Fluvanna County: 17.7% to 37.1%, up 19.4 points.
Rockbridge County: 9.8% to 27.8%, up 18.0 points.
Large divisions carry much of the student impact
Fairfax County↗ET, the largest division in the comparison, enrolled 180,130 students in 2022-23. Its chronic-absenteeism rate rose from 9.6% to 17.1%, a 7.5-point increase; 30,123 students were chronically absent in the later year.
Prince William County moved from 14.0% to 20.0%, up 6.0 points, among 91,180 students. Loudoun County moved from 9.6% to 18.8%, up 9.2 points, among 82,083 students.
Fairfax and Loudoun were at their highest rates of the four published years in 2022-23. Prince William was not: its rate had been 21.0% in 2021-22.
Across all comparable divisions, 48 of 130, or 36.9%, were at a four-year high in 2022-23.
The statewide picture
Statewide, the department's published rate fell from 20.1% in 2021-22 to 19.3% in 2022-23. That 0.8-point decline is real improvement within the published window, but the later rate remained 7.5 points above the 11.8% statewide rate in 2019-20.
The state's files establish each division's counts and rates and every four-year high used here. They do not separate changes in attendance behavior from changes in enrollment, school calendars, reporting or other conditions, so this analysis does not assign a cause to any division's increase or decrease.
Source note: The analysis uses chronic-absenteeism reports and enrollment records published by the Virginia Department of Education.
Detailed code that reproduces the analysis and figures in this article is available exclusively to EdTribune subscribers.
Discussion
Sign in to join the discussion.
Loading comments...