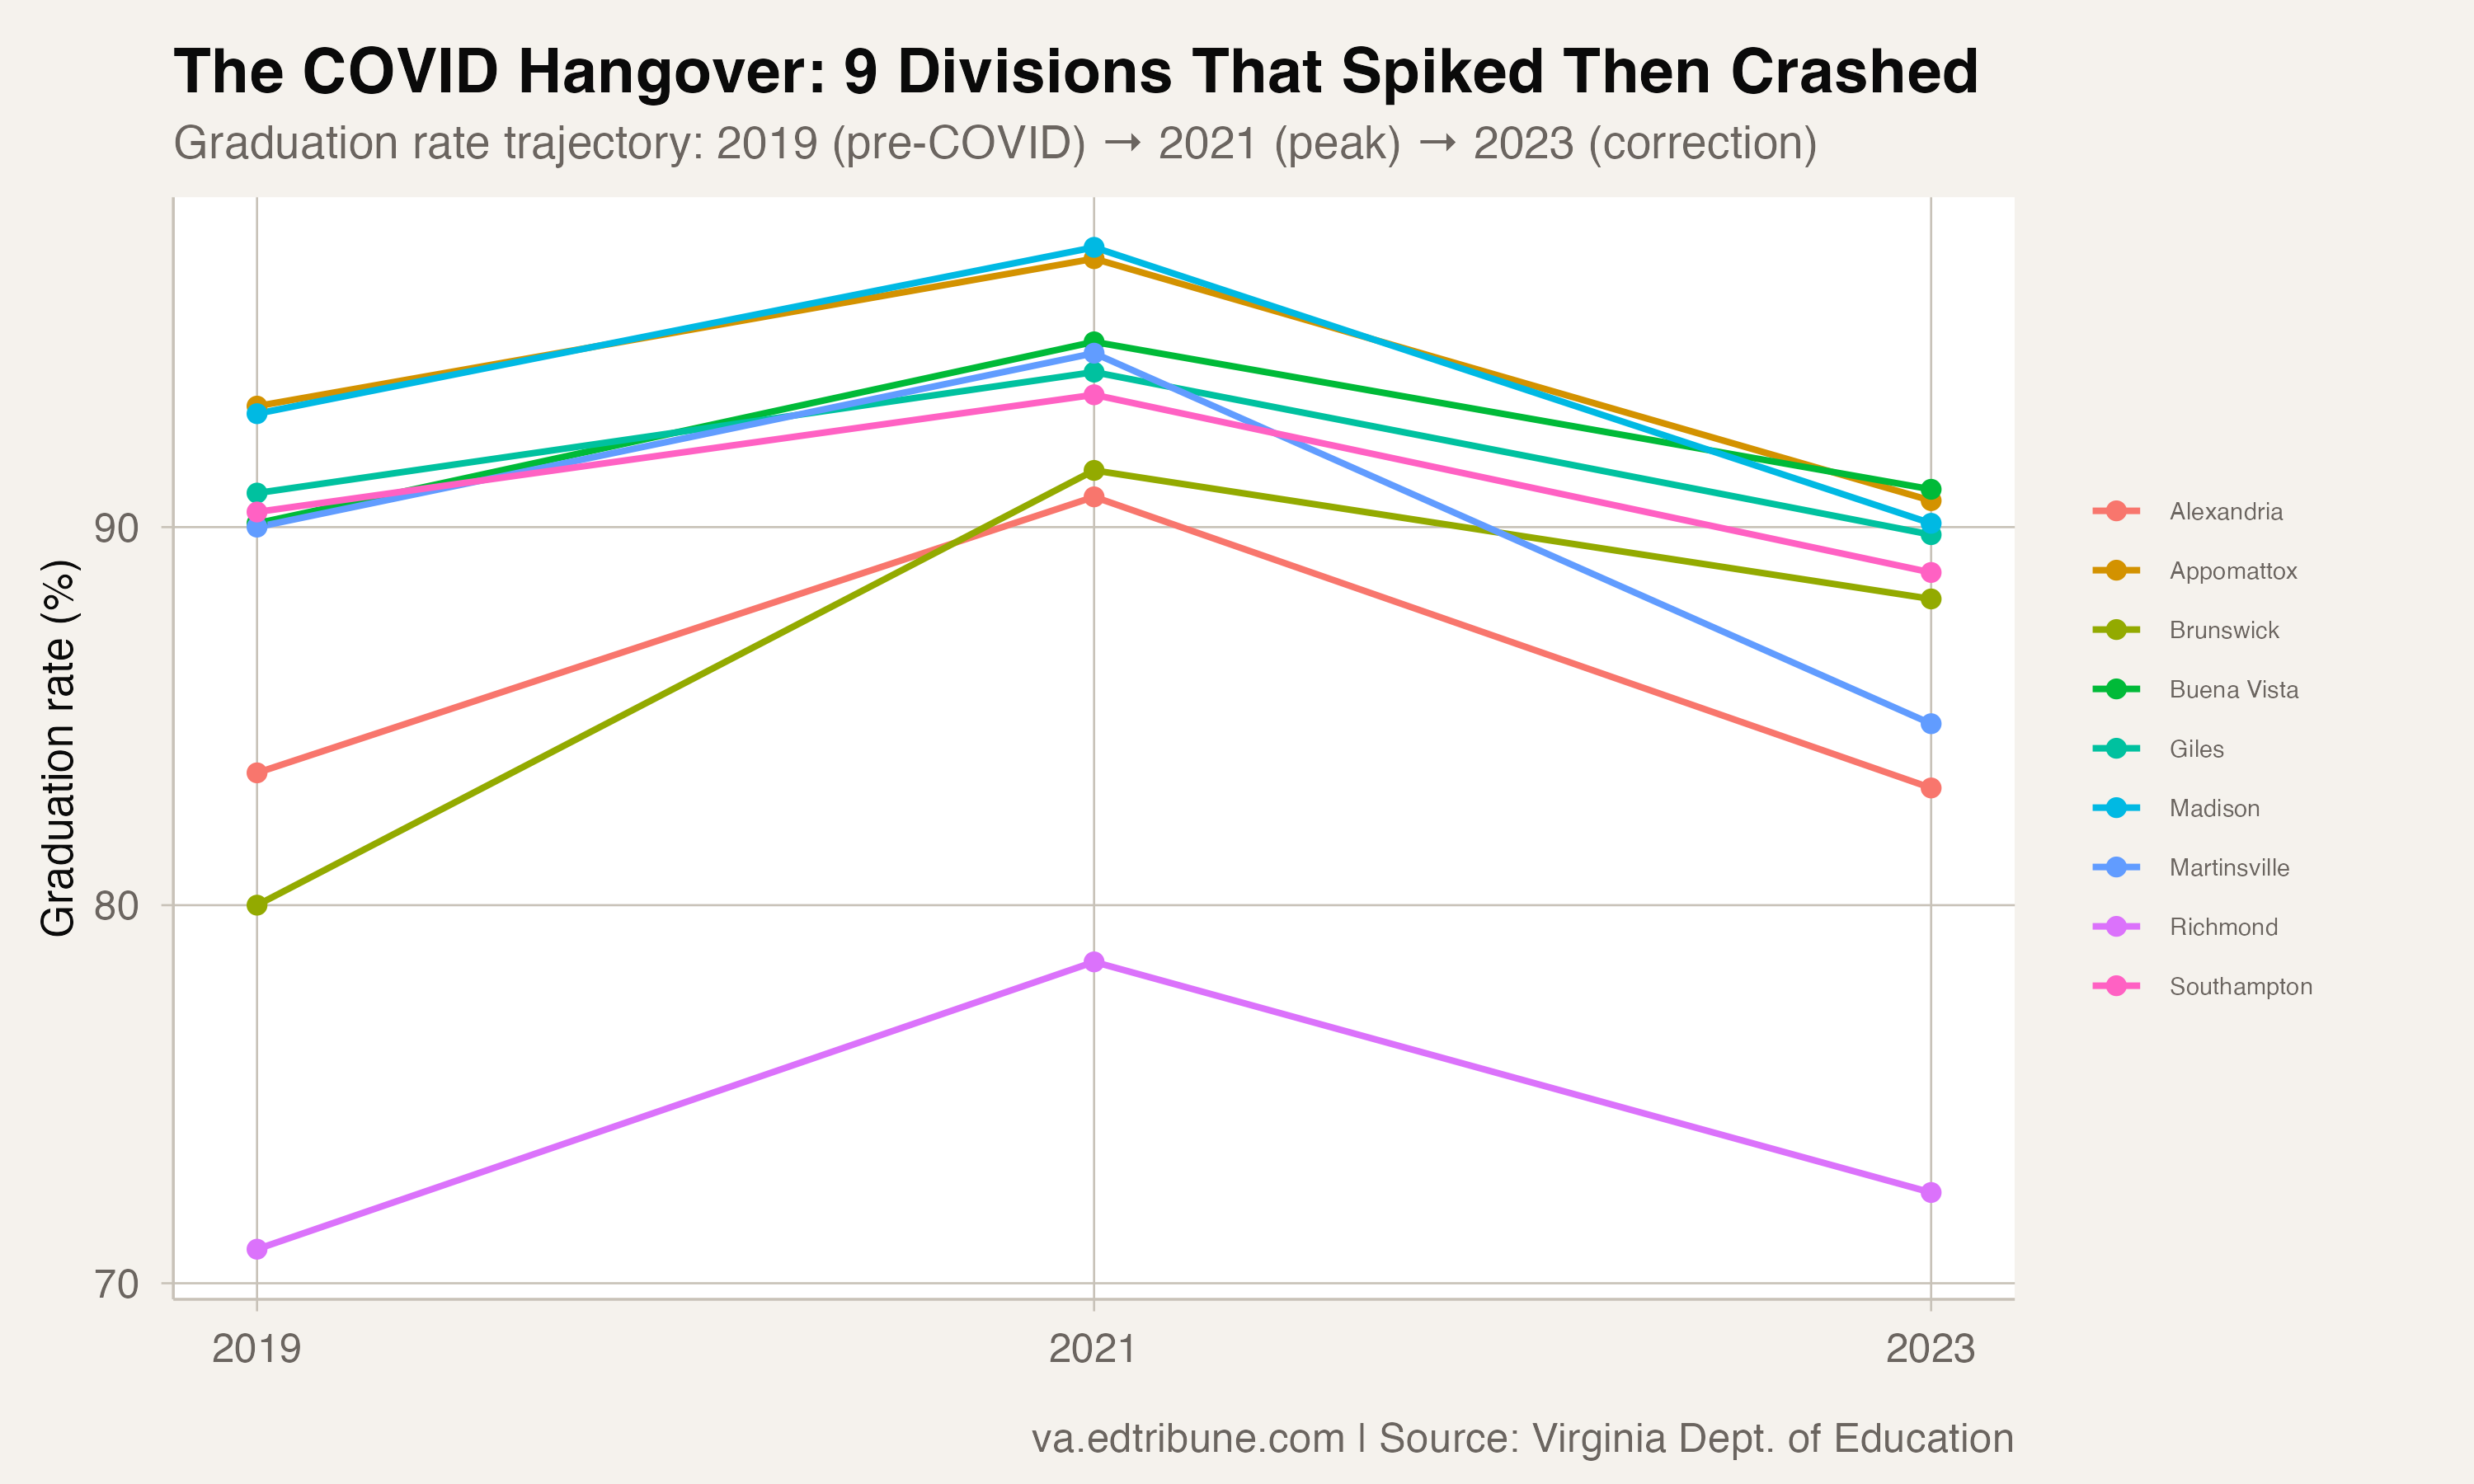
Virginia's graduation data shows a sharp spike-and-fall pattern in a small group of school divisions. Nine divisions rose by three or more points from 2019 to 2021, then fell by three or more points by 2023.
For some, the crash simply returned them to where they started. For others, it went further, leaving them below their pre-COVID baseline.
The Pattern
The nine divisions share a distinctive trajectory. Their graduation rates rose sharply from 2019 to 2021. Then the rates fell back by 2023, often steeply. The data shows the timing and size of the change; it does not identify the cause.
Alexandria City↗ET is the starkest example. Its graduation rate was 83.5% in 2019. During the COVID flexibility period, it climbed to 90.8%, a gain of 7.3 points. By 2023, it had fallen to 83.1%, a drop of 7.7 points from the peak. The net result: Alexandria ended 0.4 points lower than where it started.
Martinsville↗ET shows a similar pattern with a harsher reversal. The rate rose 4.6 points by 2021 and then fell 9.8 points, leaving Martinsville 5.2 points below its 2019 baseline.
Who Ended Up Below Their Baseline
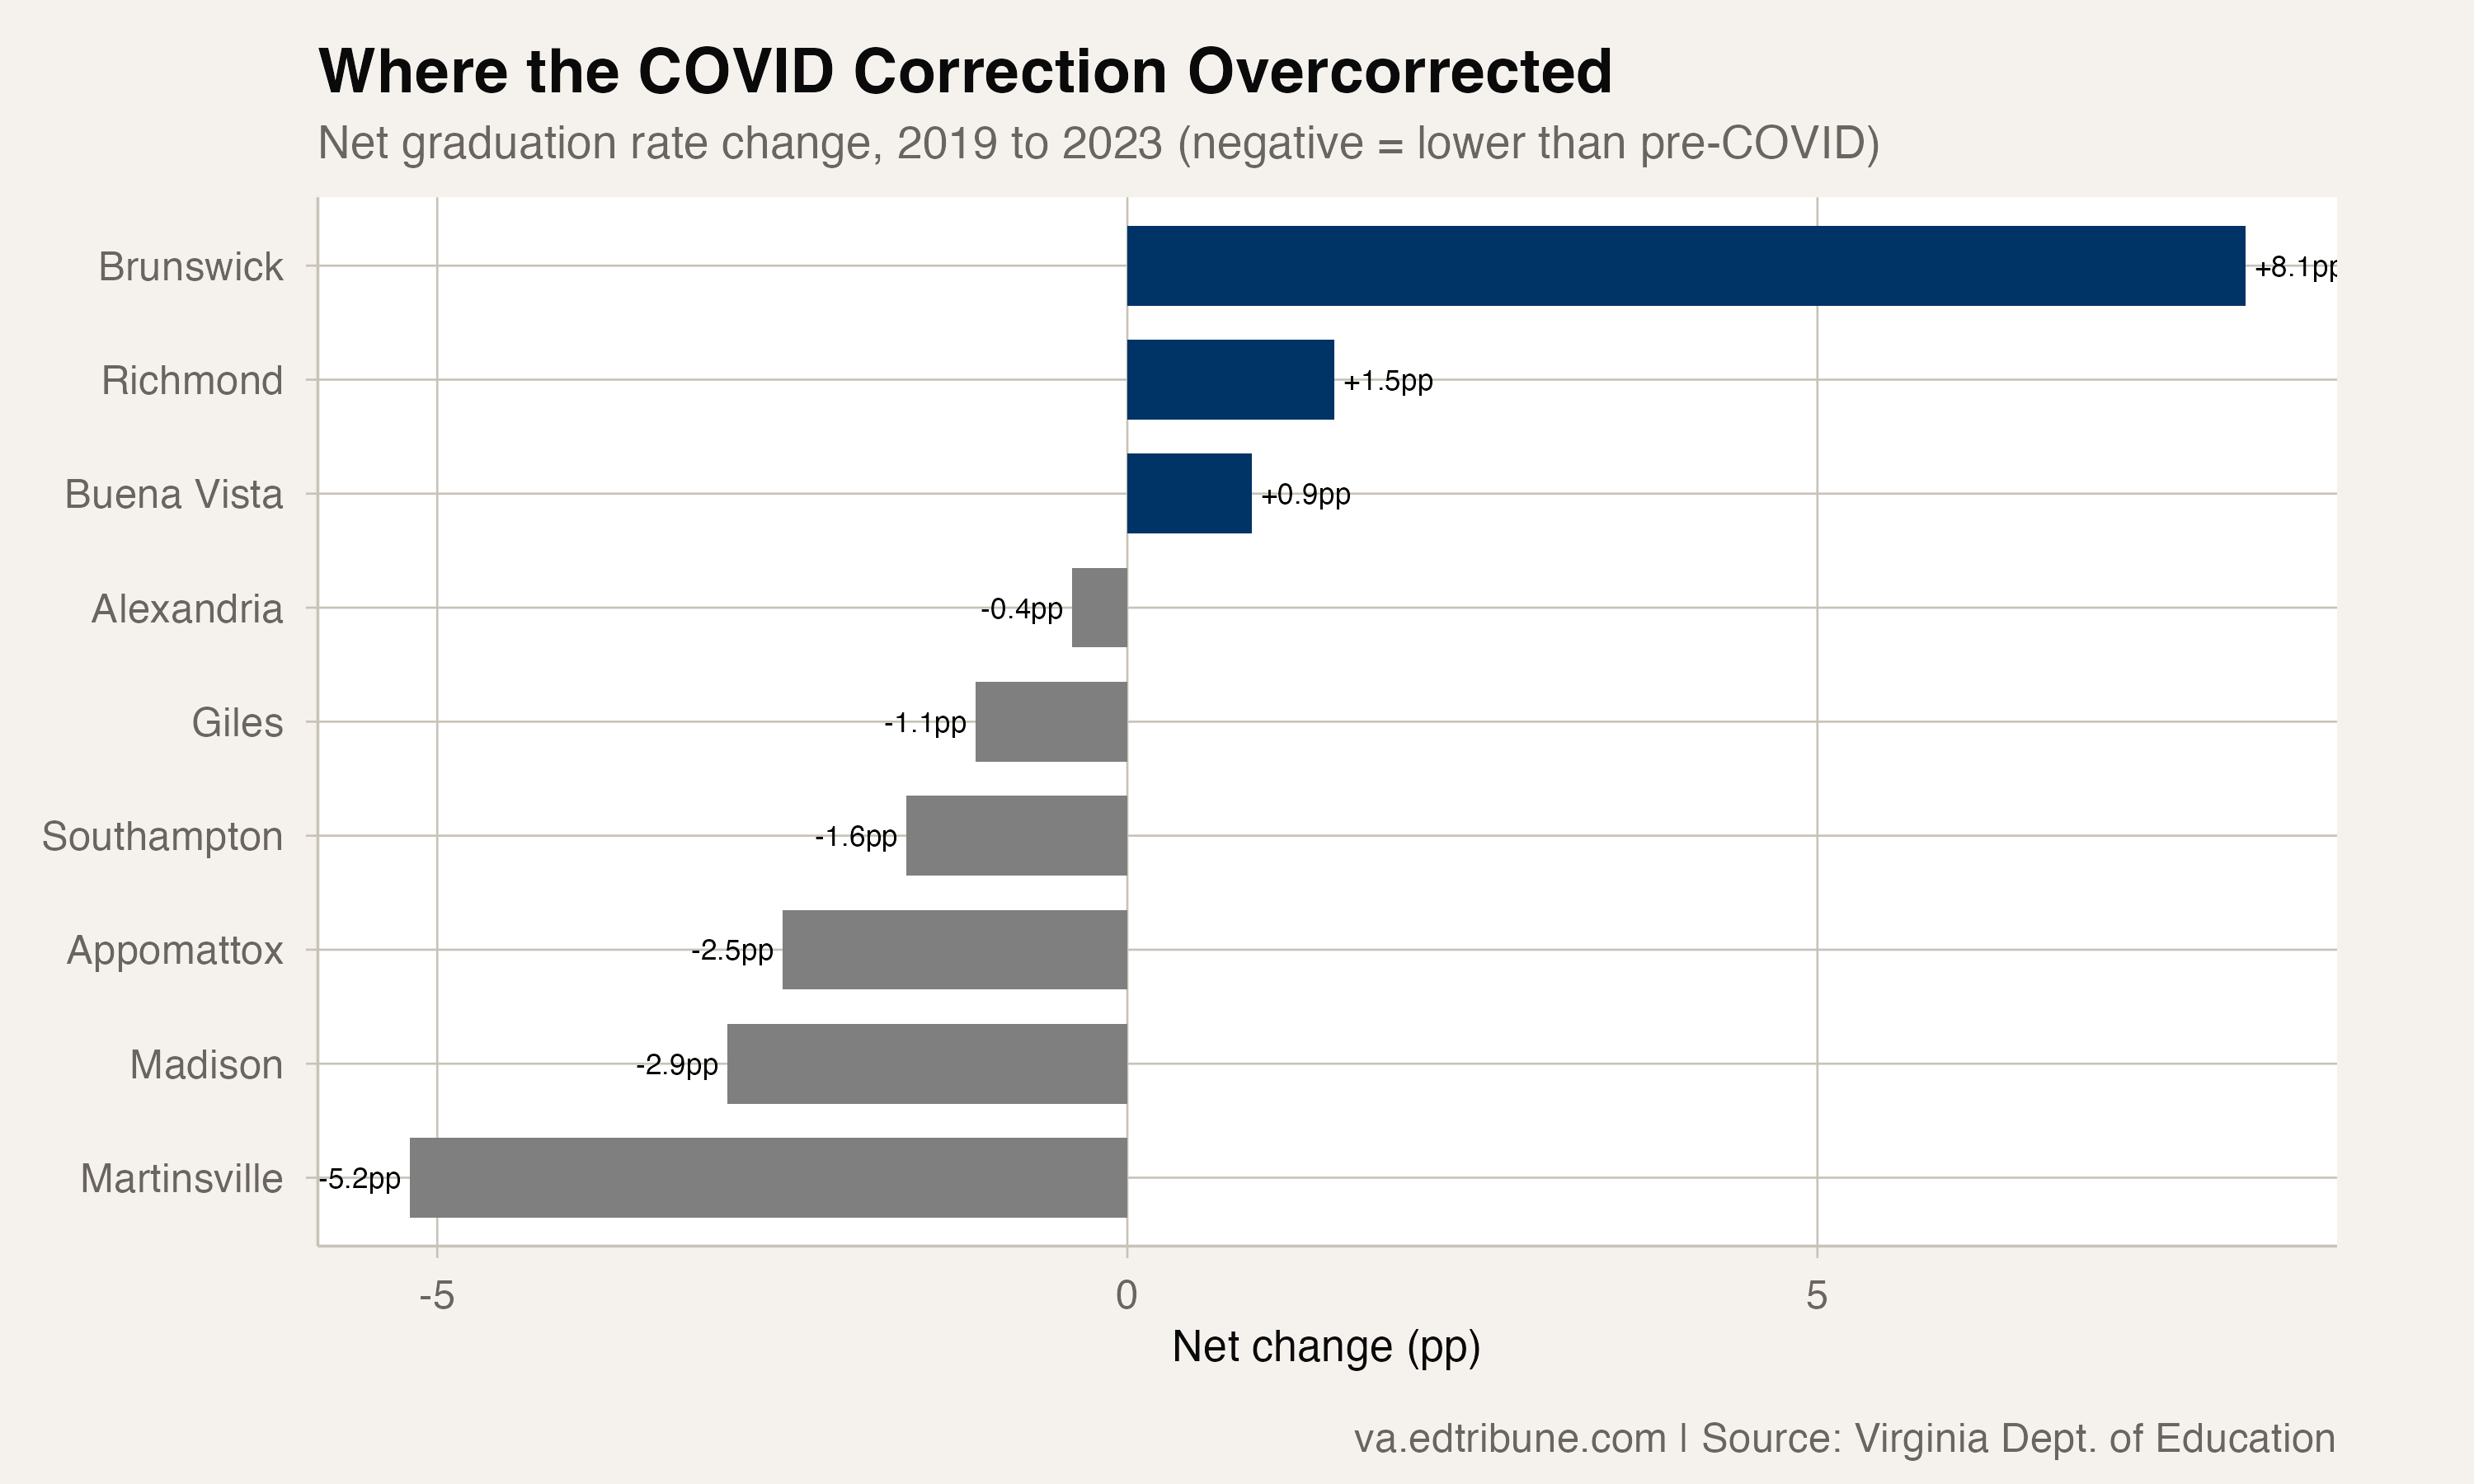
Of the nine divisions with the spike-then-crash pattern, six ended 2023 below their 2019 graduation rate. The data does not say whether those declines reflect policy changes, student disengagement, local disruption, cohort composition or some combination of factors. It only shows that the 2021 gains did not hold.
Richmond City↗ET, by contrast, experienced a large spike (+7.6 points) and a large crash (-6.1 points) but ended with a net gain of 1.5 points. The surge and correction were dramatic, but Richmond was marginally better off at the end.
Alexandria: A Case Study
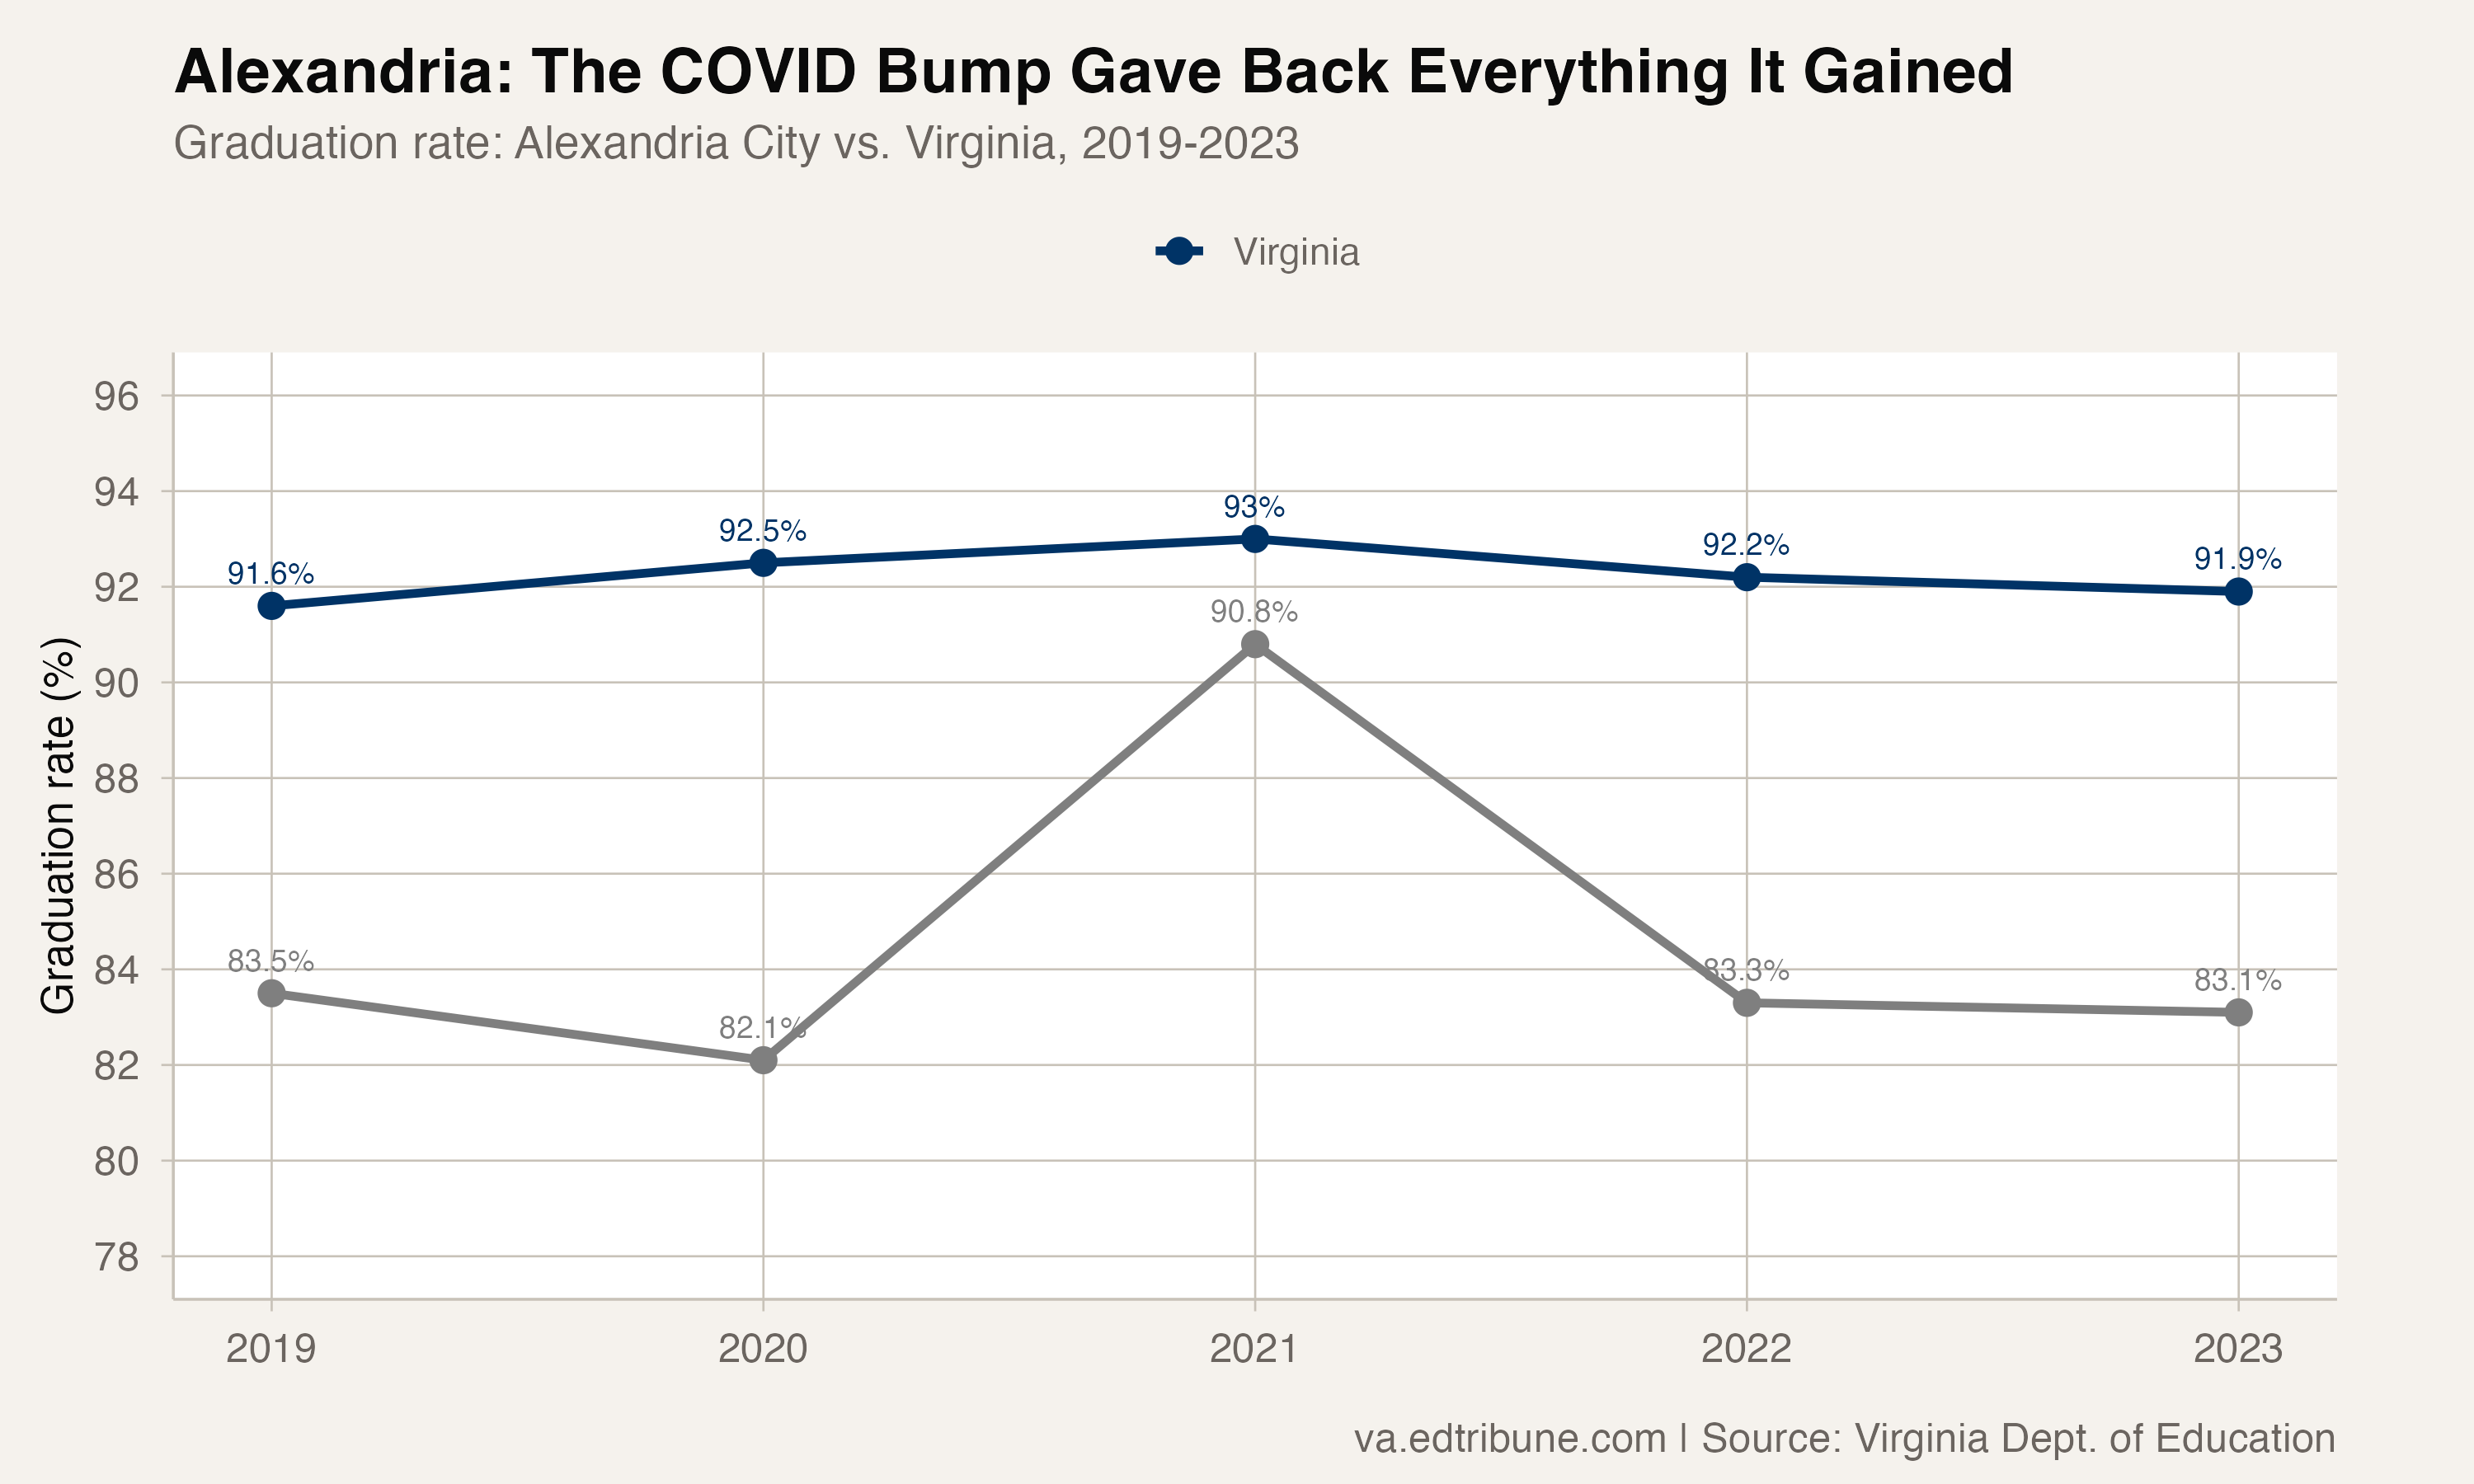
Alexandria City's 2019 graduation rate of 83.5% was already below the state average. The 2021 jump to 90.8% moved it much closer to the state rate, but did not erase the gap. By 2023, Alexandria was back to 83.1%, widening the state gap again.
Alexandria is left with an uncomfortable question: what changed between the 90.8% rate in 2021 and the 83.1% rate two years later? The graduation file can identify the drop. It cannot explain it.
The nine divisions in this pattern should be treated as a warning label. A temporary graduation-rate jump can look like progress in the moment. The more important question is whether the improvement survives after conditions change.
Detailed code that reproduces the analysis and figures in this article is available exclusively to EdTribune subscribers.
Discussion
Sign in to join the discussion.
Loading comments...