Correction: An earlier version called the five-year panel maximum an all-time high, described Virginia Beach's cohort as the state's second-largest, and misstated the division's dropout-rate range. It also presented unverified program, policy, culture, and persistence explanations. This version reports the executed package comparisons without those causal claims.
Virginia Beach City↗ET reported a 95.3% graduation rate for a cohort of 5,111 students in 2023. That was the fourth-largest cohort among 130 current division rows, not the second-largest.
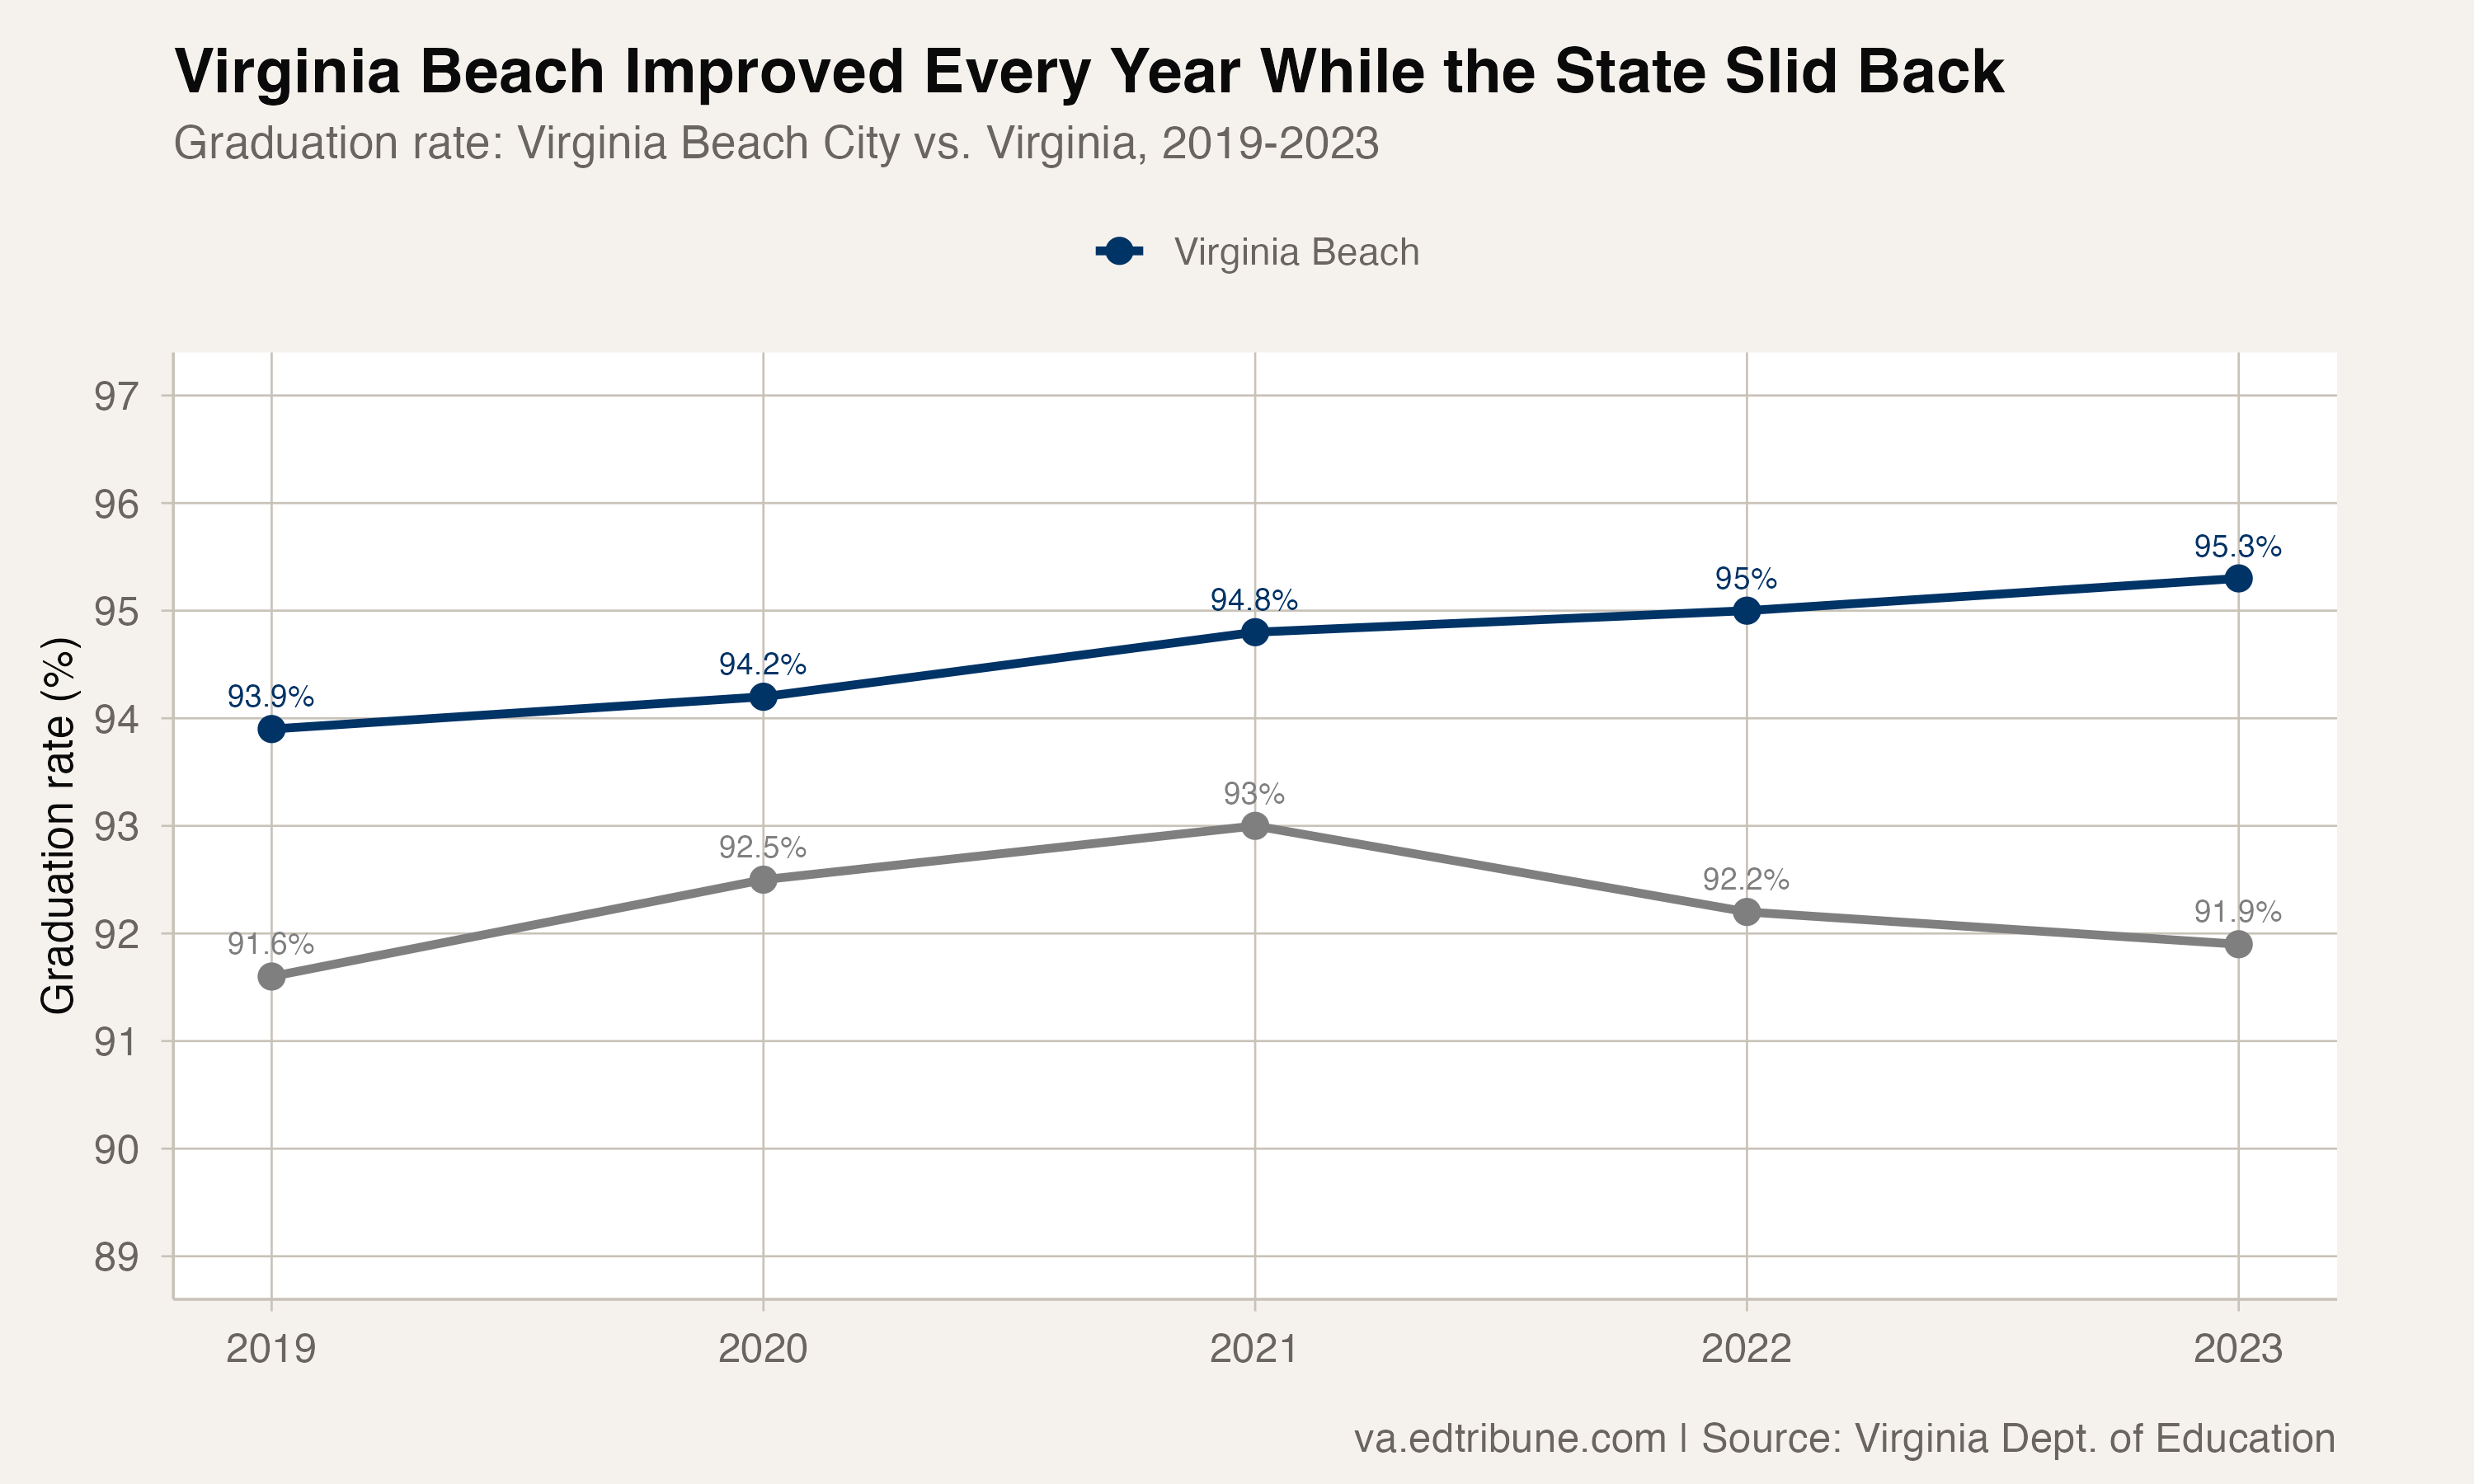
Virginia Beach was the only one of 128 divisions with a complete 2019-2023 panel to improve in all four annual transitions. The finding is a strict comparison of the rates in those five package years, not an all-time record.
Four gains produced a 1.4-point endpoint increase
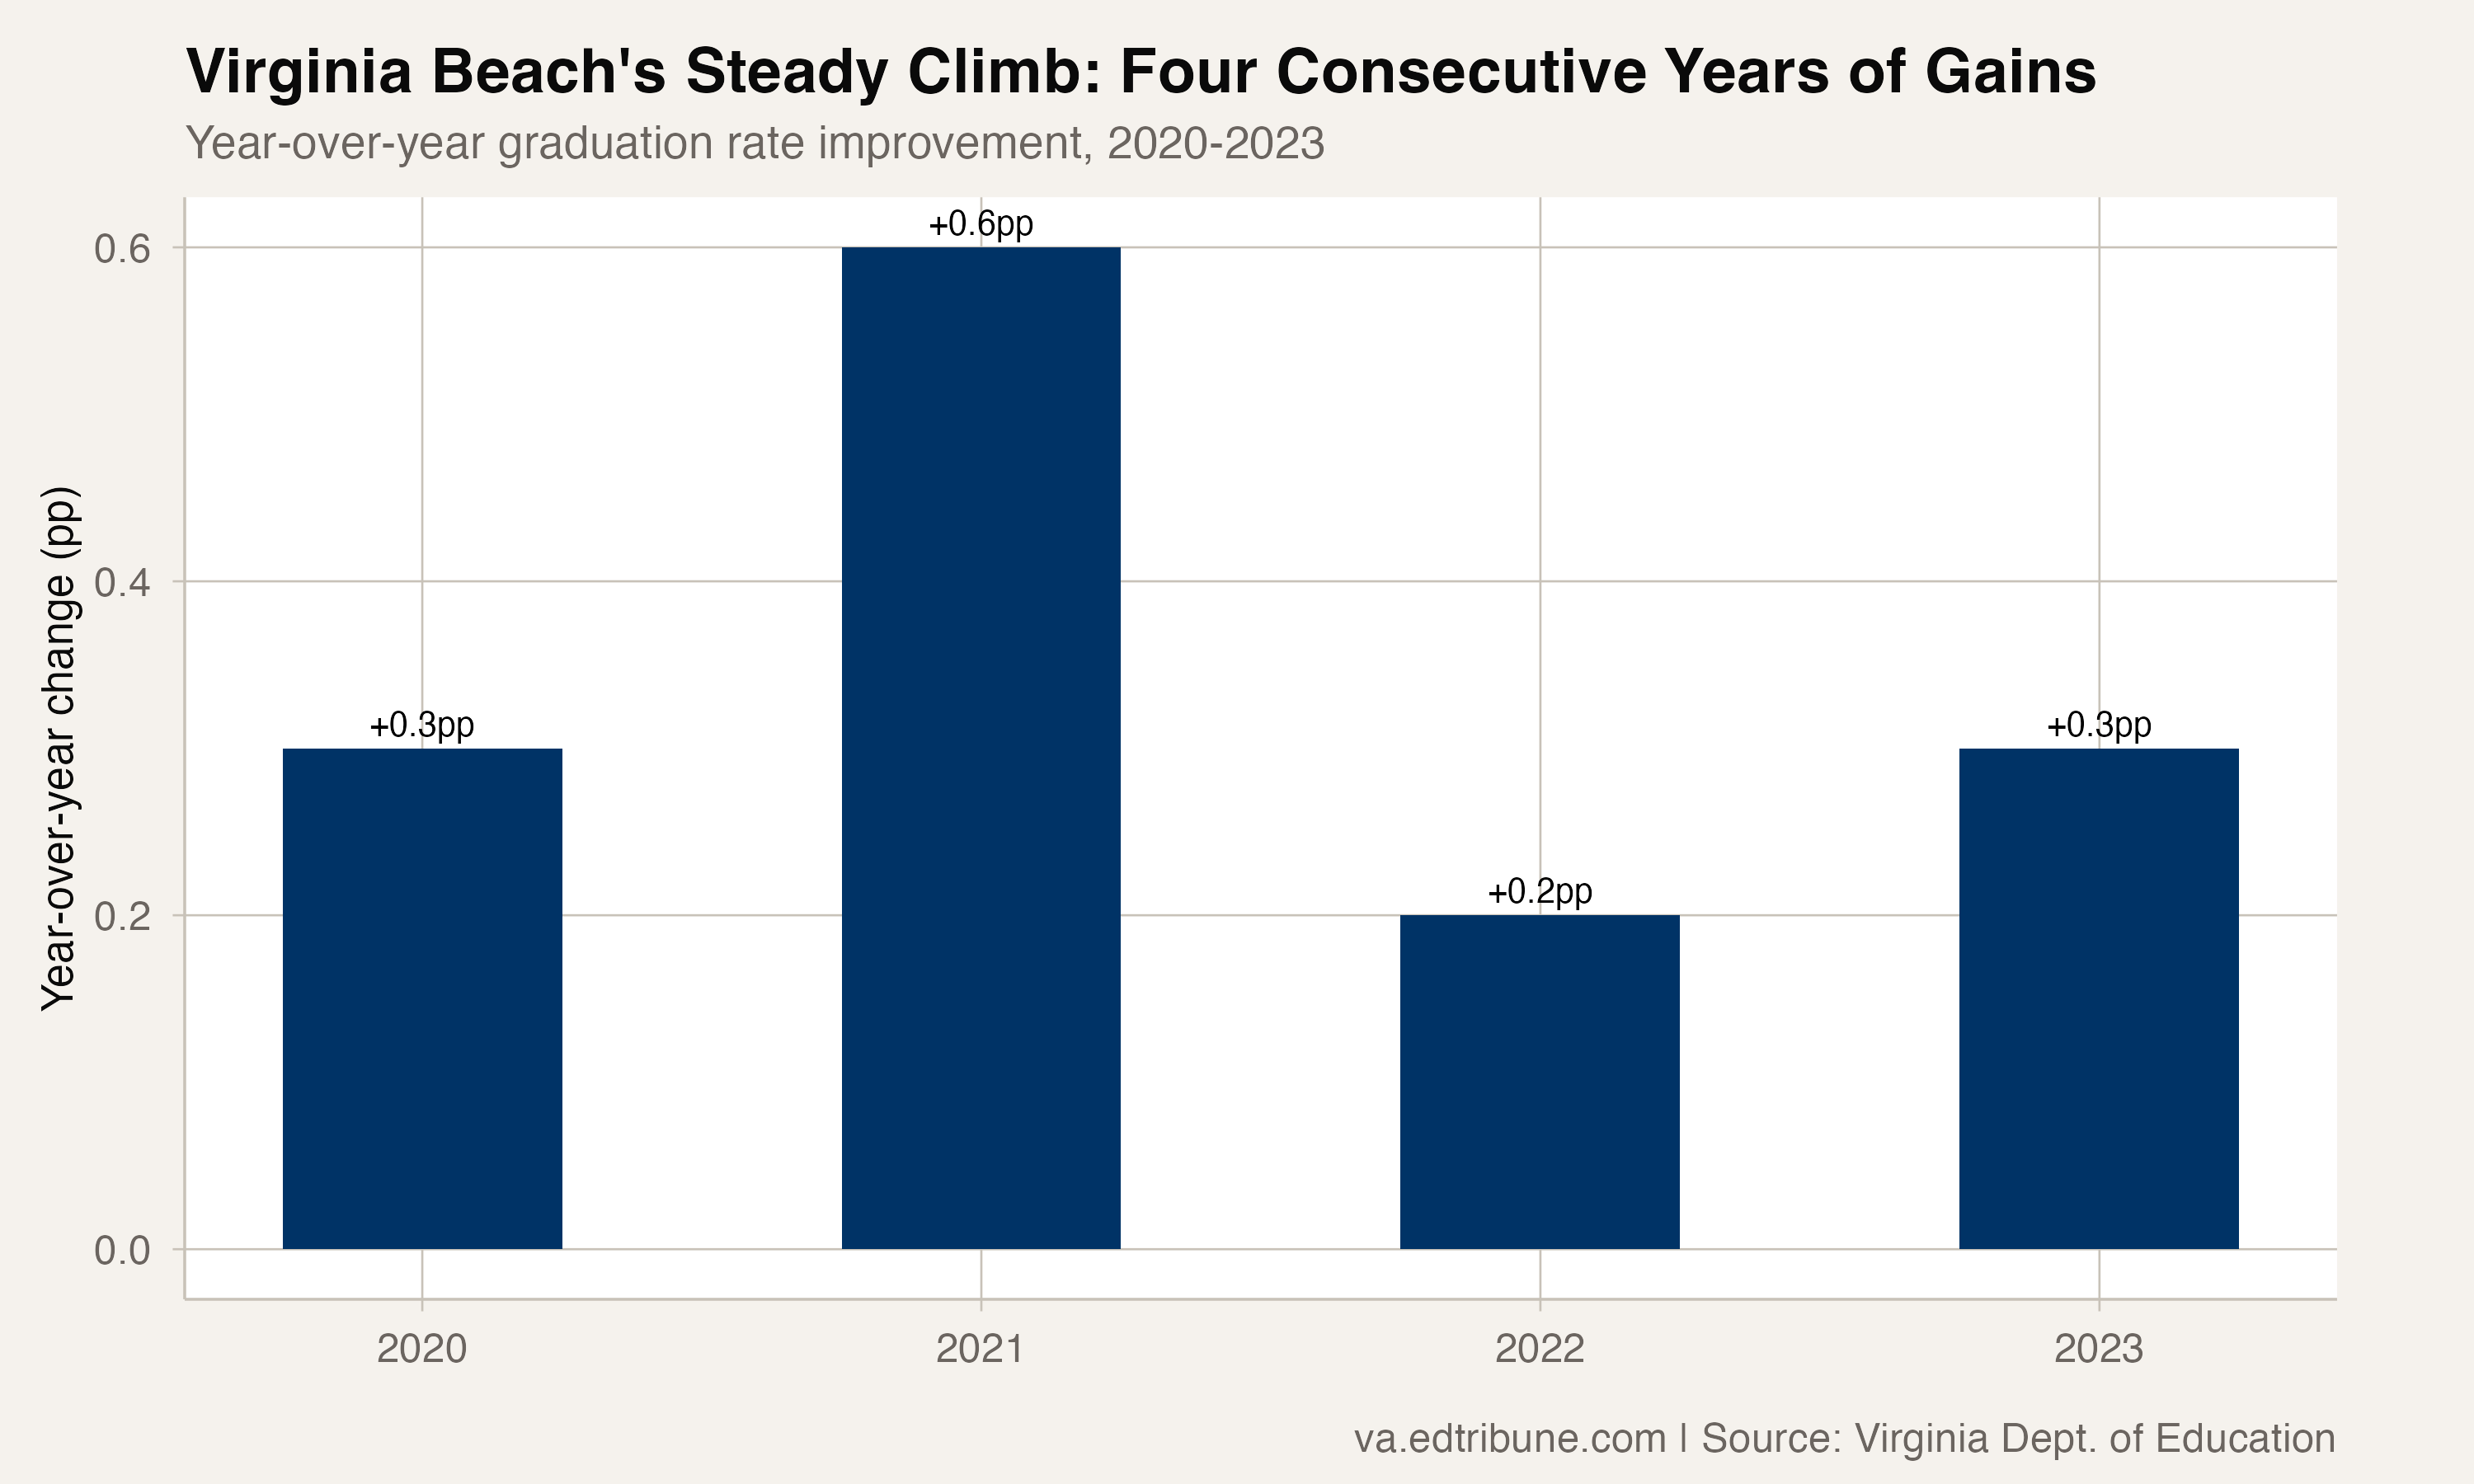
Virginia Beach's displayed graduation rate was 93.9% in 2019, 94.2% in 2020, 94.8% in 2021, 95.0% in 2022, and 95.3% in 2023. The annual gains were 0.3, 0.6, 0.2, and 0.3 percentage points. The endpoint increase was 1.4 points.
Virginia's statewide rate followed a different path: 91.6% in 2019, 92.5% in 2020, 93.0% in 2021, 92.2% in 2022, and 91.9% in 2023. The state panel peak was therefore 2021.
Virginia Beach's displayed advantage over the state widened from 2.3 points at the 2019 endpoint to 3.4 points in 2023. Those aggregate rows establish the relative changes; they do not identify why the division and state moved differently.
The dropout rate stayed within a 0.3-point band
Virginia Beach's displayed dropout rates were 3.0%, 2.8%, 2.7%, 2.8%, and 2.8% from 2019 through 2023. The verified range was 2.7% to 3.0%, not 2.4% to 3.1%.
The statewide dropout rate was 5.4% in 2023, compared with Virginia Beach's 2.8%. The package establishes those reported rates and the graduation streak. It does not test whether career programs, policies, school culture, cohort composition, or another mechanism produced the pattern, nor whether the streak continued beyond the panel.
Detailed code that reproduces the analysis and figures in this article is available exclusively to EdTribune subscribers.
Discussion
Sign in to join the discussion.
Loading comments...