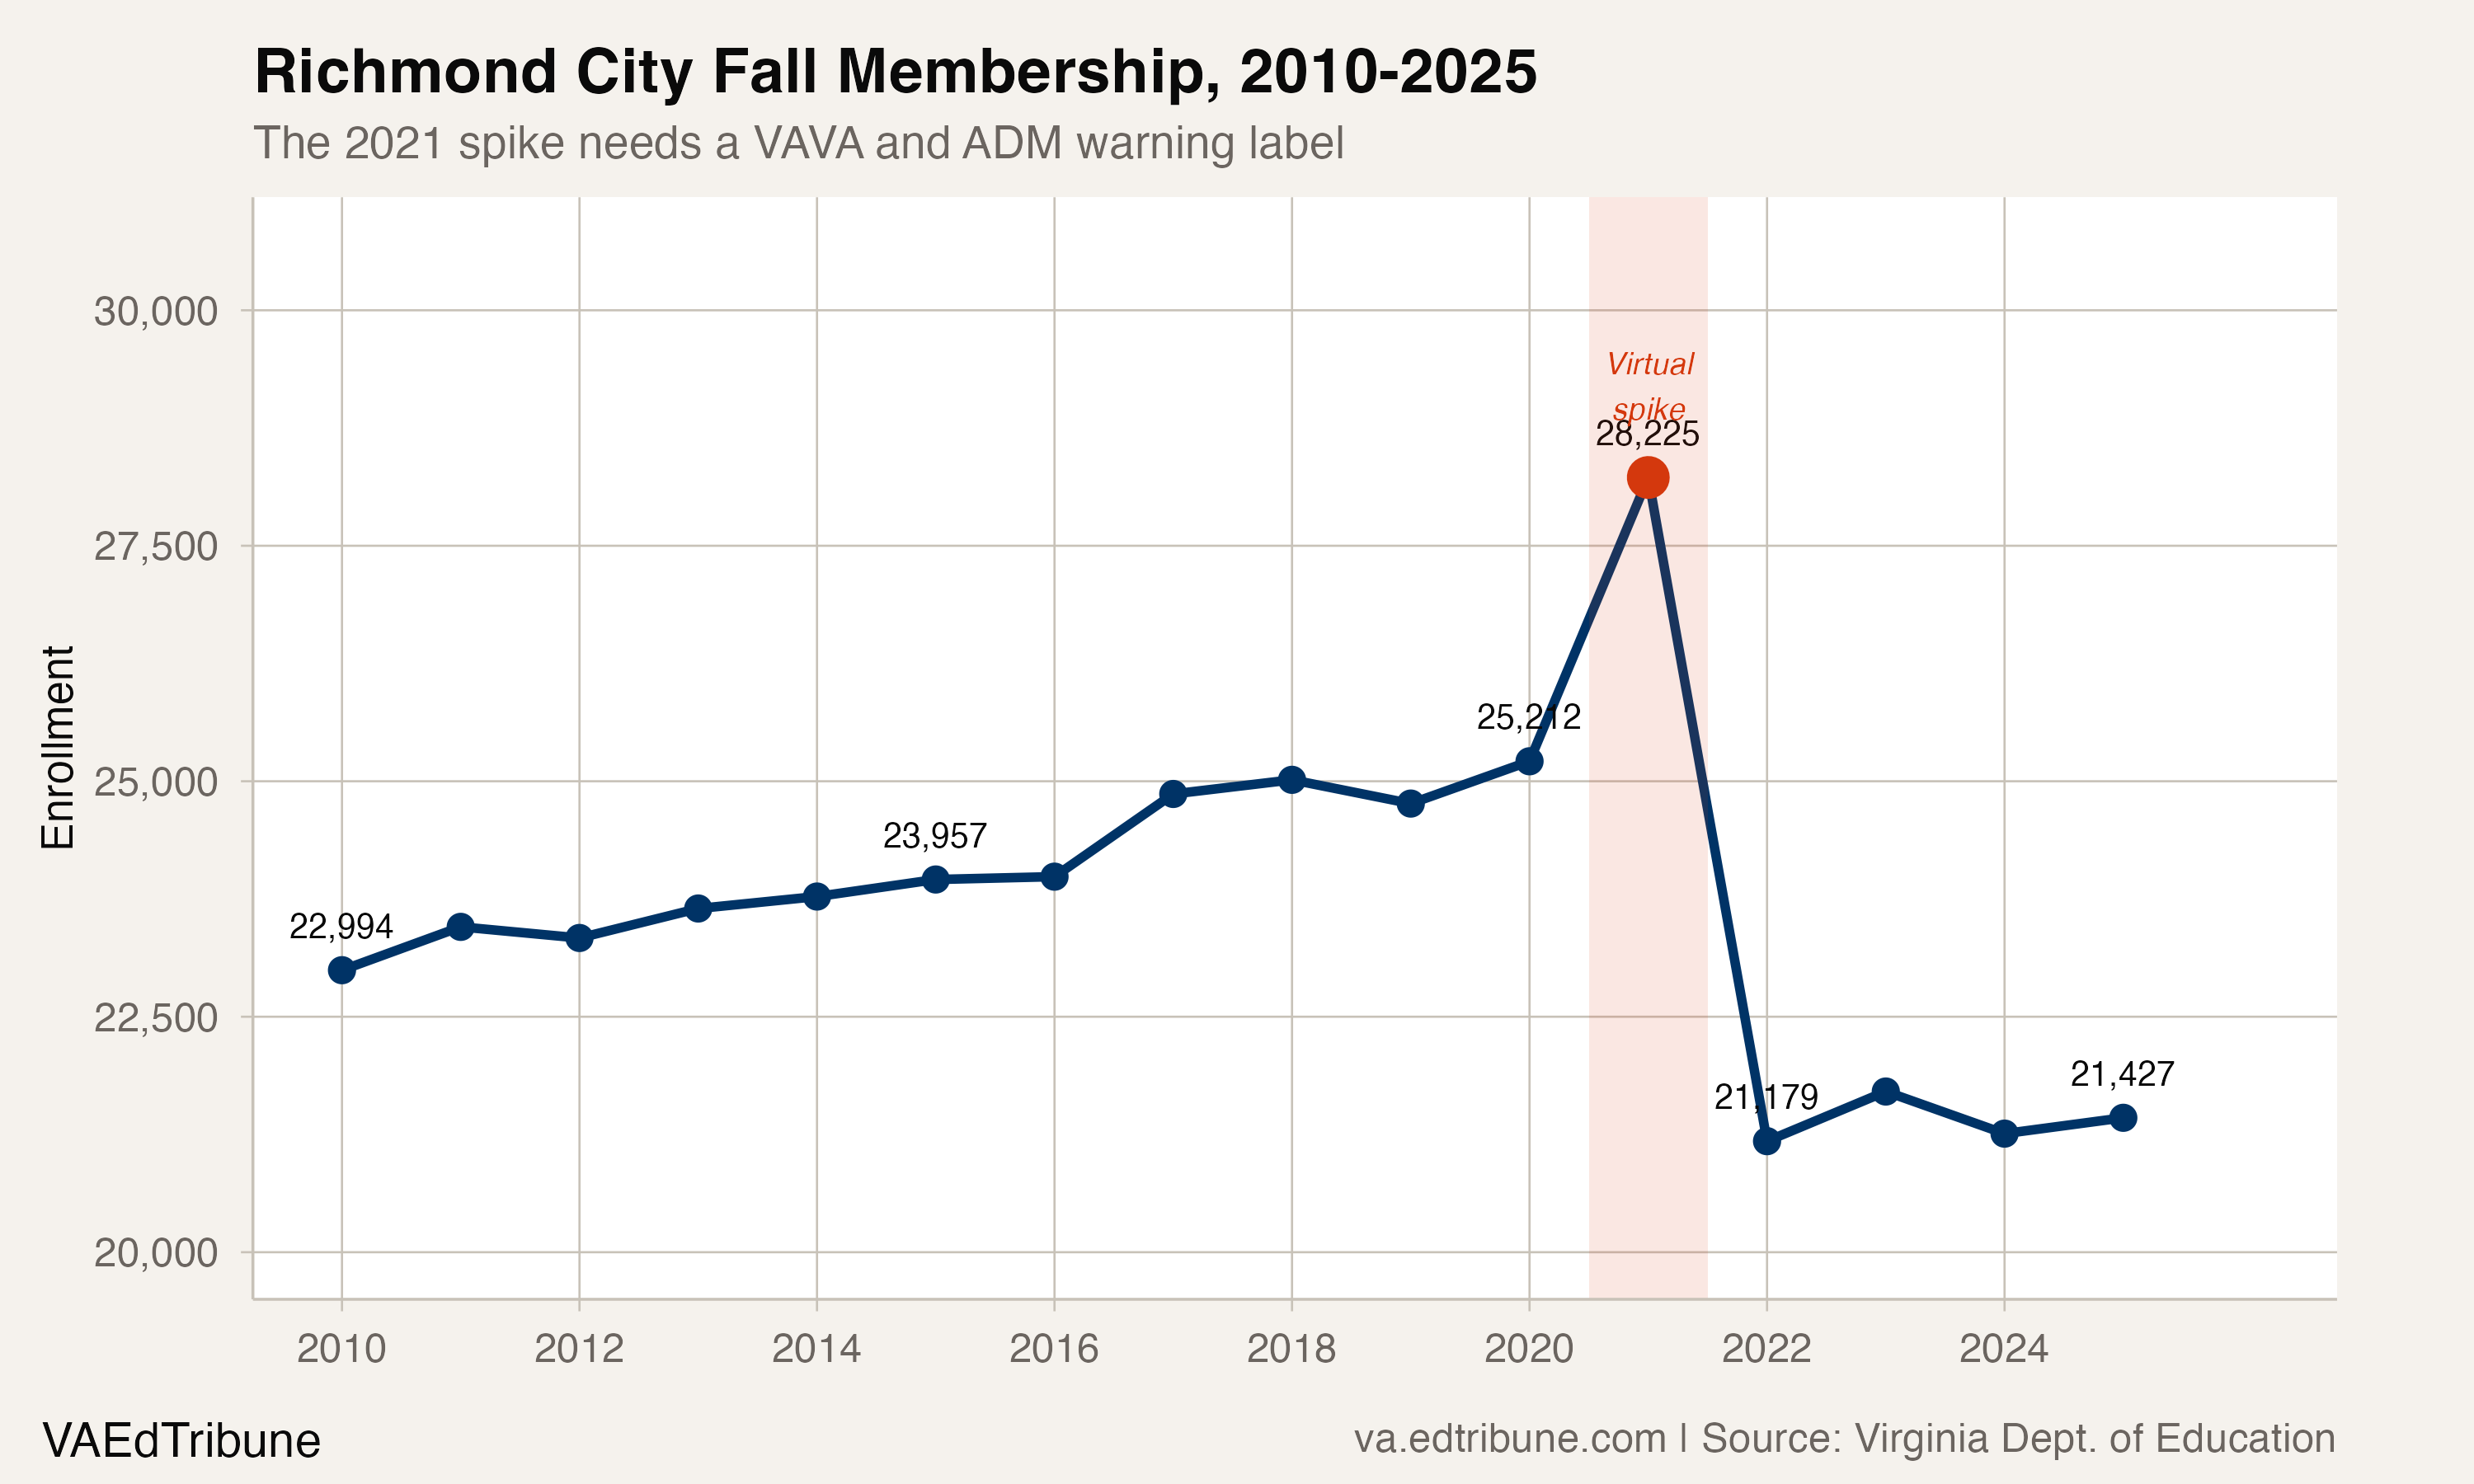
Richmond City↗ET still has fewer students in the state fall-membership file than it did two decades ago: 26,136 in 2003 and 21,427 in 2025, a loss of 4,709 students, or 18.0%.
But that state series is not a clean count of Richmond children sitting in Richmond classrooms. The correction starts in Richmond Public Schools' own budget books. The FY2021 RPS budget projected 21,500 March 31 average daily membership, or ADM, while also projecting 25,200 September membership, including about 1,660 Pre-K students and 2,000 virtual students. The FY2026 RPS budget describes Virginia Virtual Academy at Richmond City as an online school for resident and non-resident students enrolled through the division under Virginia's multi-district provider statute.
That direct evidence changes how the 2021 spike should be read. The state fall-membership file shows Richmond rising from 25,212 students in 2020 to 28,225 in 2021, then falling to 21,179 in 2022. The jump and crash are real in the VDOE data. They are not evidence that Richmond classrooms gained 3,013 local students and then lost 7,046.
Two Counts, Two Stories
Fall membership answers one question: how many students were reported in the division's September count. ADM answers a different question: what student count drives most state funding. RPS says March 31 ADM is the count used for most state aid, while fall membership is a September snapshot.
That distinction matters here because the fall-membership trend and the budget trend point to different conclusions. In the state fall-membership data, Richmond looks as if it recovered to about 25,000 students in the late 2010s and then collapsed after 2021. In the RPS budget frame, the division was planning around a much lower ADM before, during, and after the COVID period.
The safest reading is narrower than the original fall-membership story: Richmond's long-run decline is real, but the late-2010s rebound and 2021 surge cannot be treated as local classroom growth without the VAVA caveat.
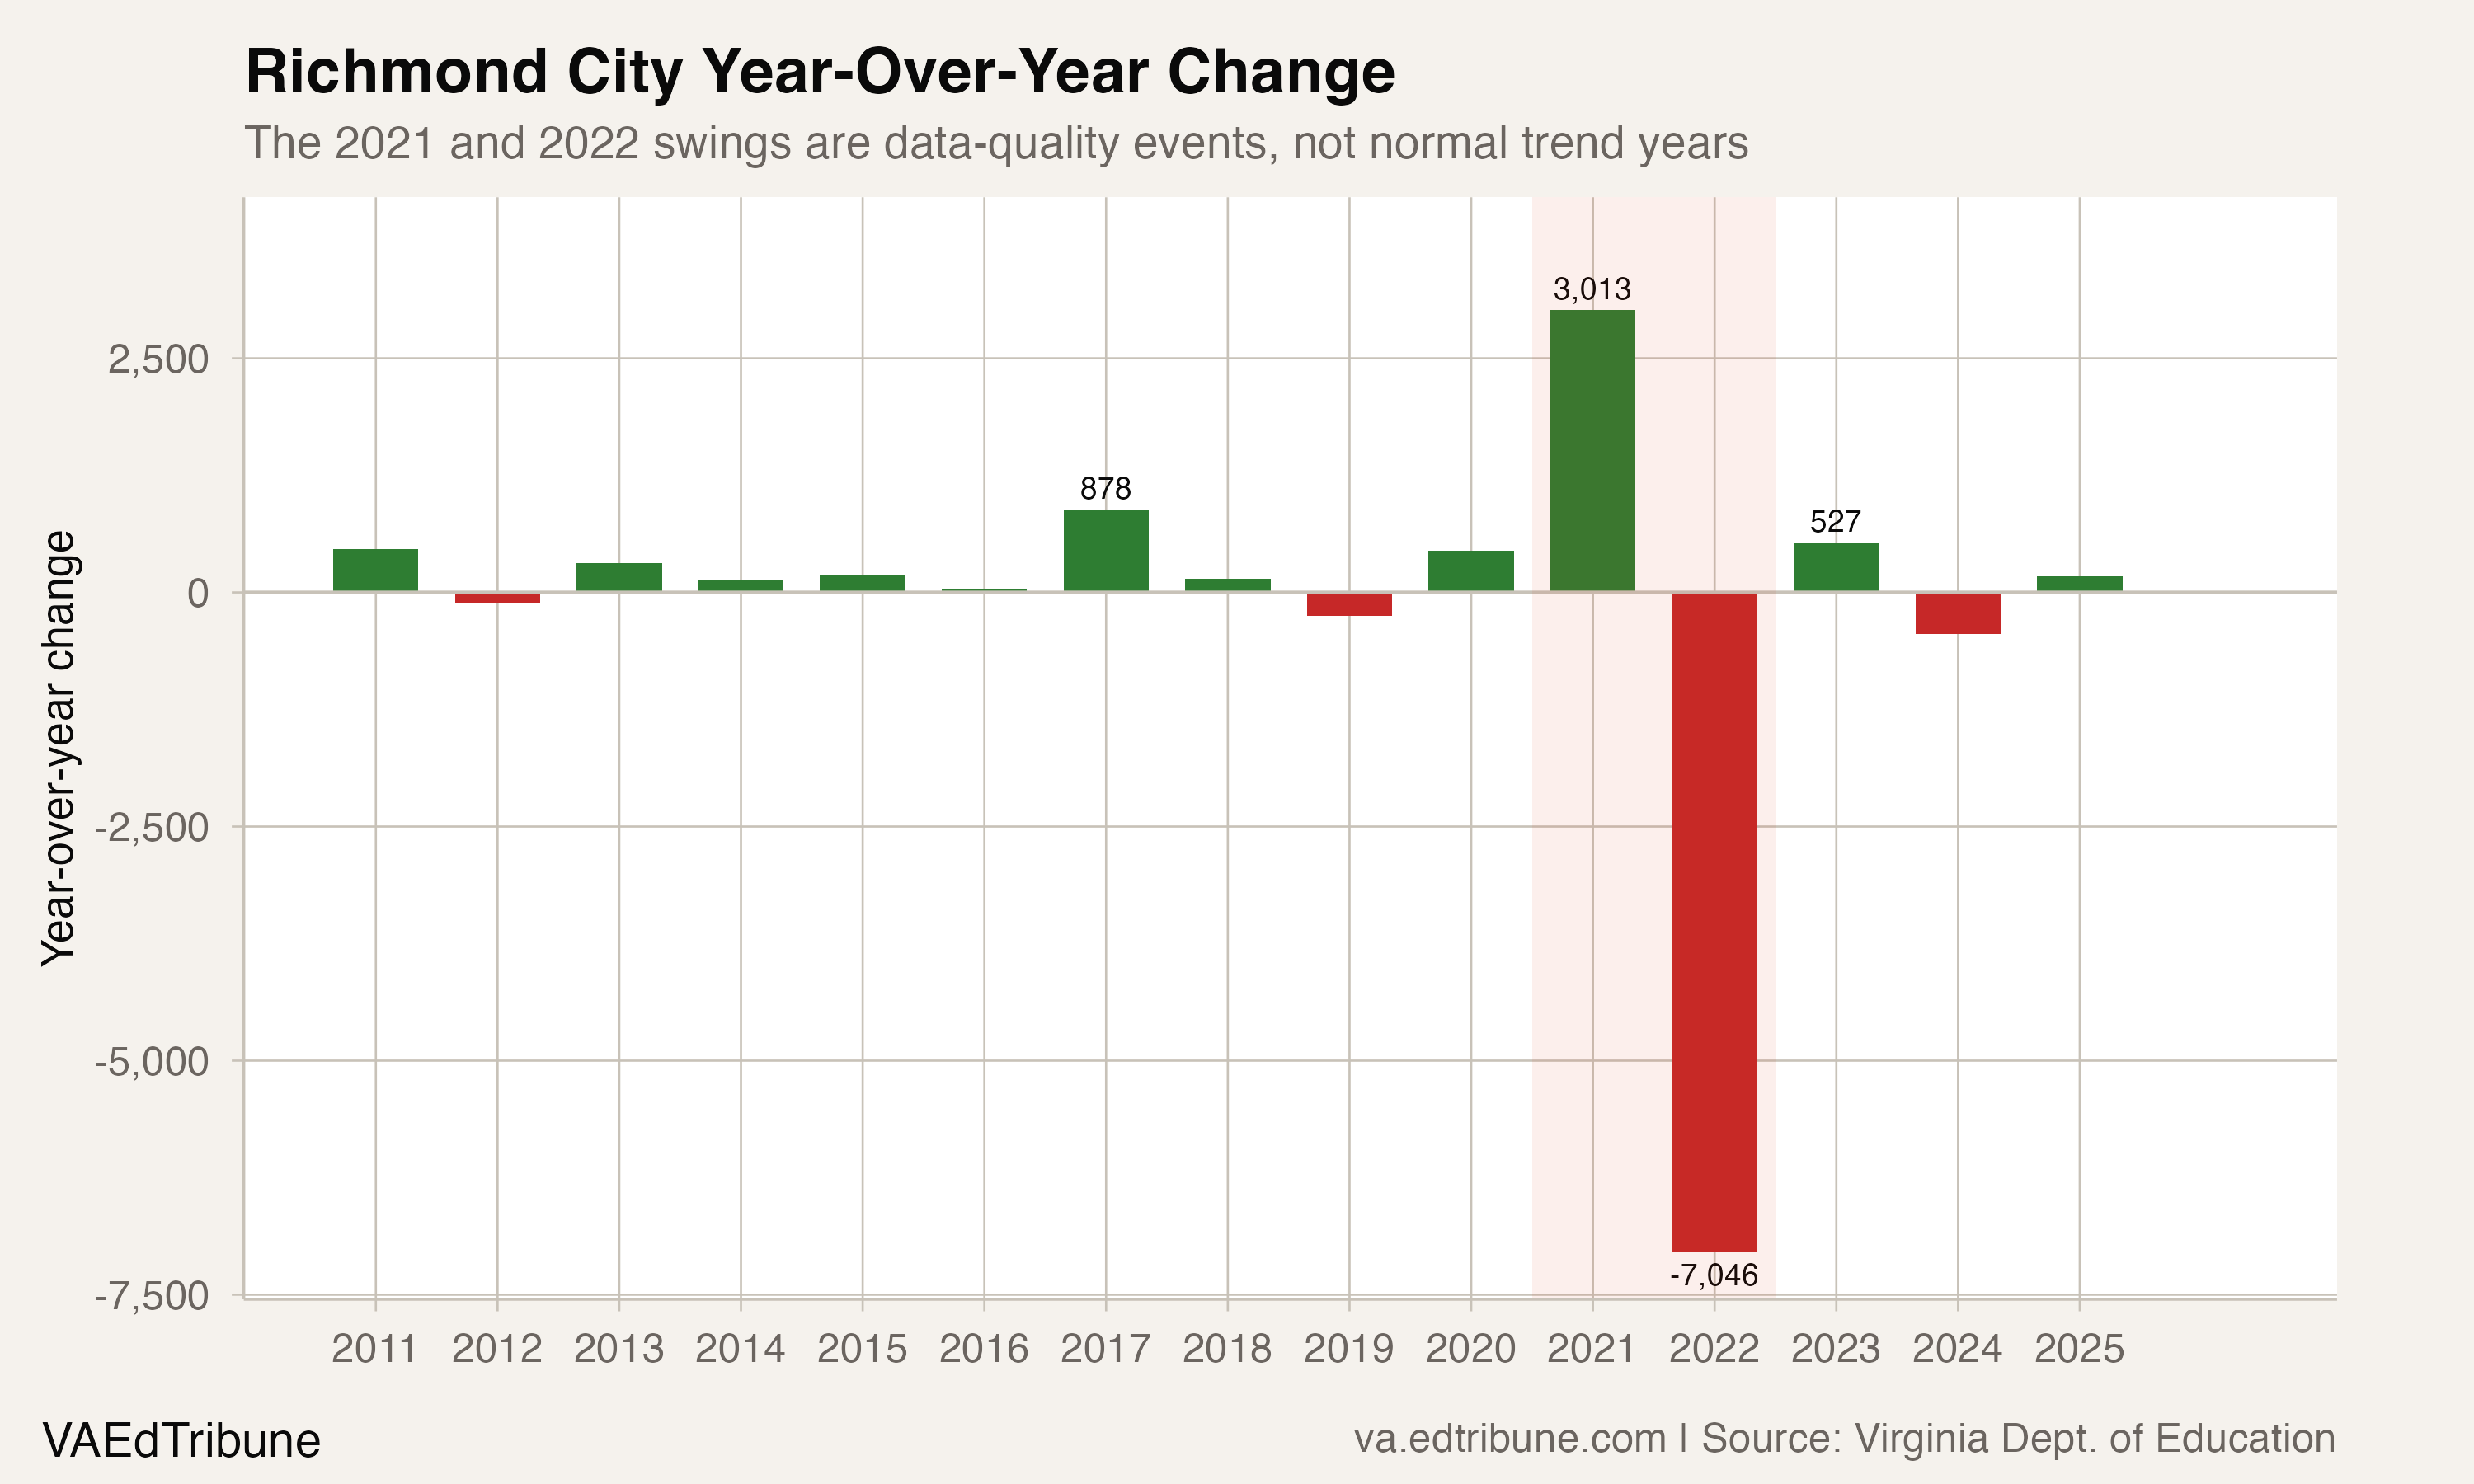
The year-over-year changes make the data problem impossible to miss. Outside 2021 and 2022, Richmond's largest one-year fall-membership swing in this series was 878 students. The 2021 spike was 3,013 students, and the 2022 correction was 7,046 students.
After the 2022 reset, the state fall-membership count no longer shows continuing collapse. Richmond reported 21,179 students in 2022 and 21,427 in 2025, a net gain of 248 students, or 1.2%. RPS director of enrollment Luke Hostetter told the Richmond Free Press that fall membership has been "stable, despite what we have seen, what projections have indicated across the state of Virginia and particularly for urban areas rebounding from the COVID-19 pandemic." The state data now supports the stability claim for the post-correction period.
The Demographic Shift Remains
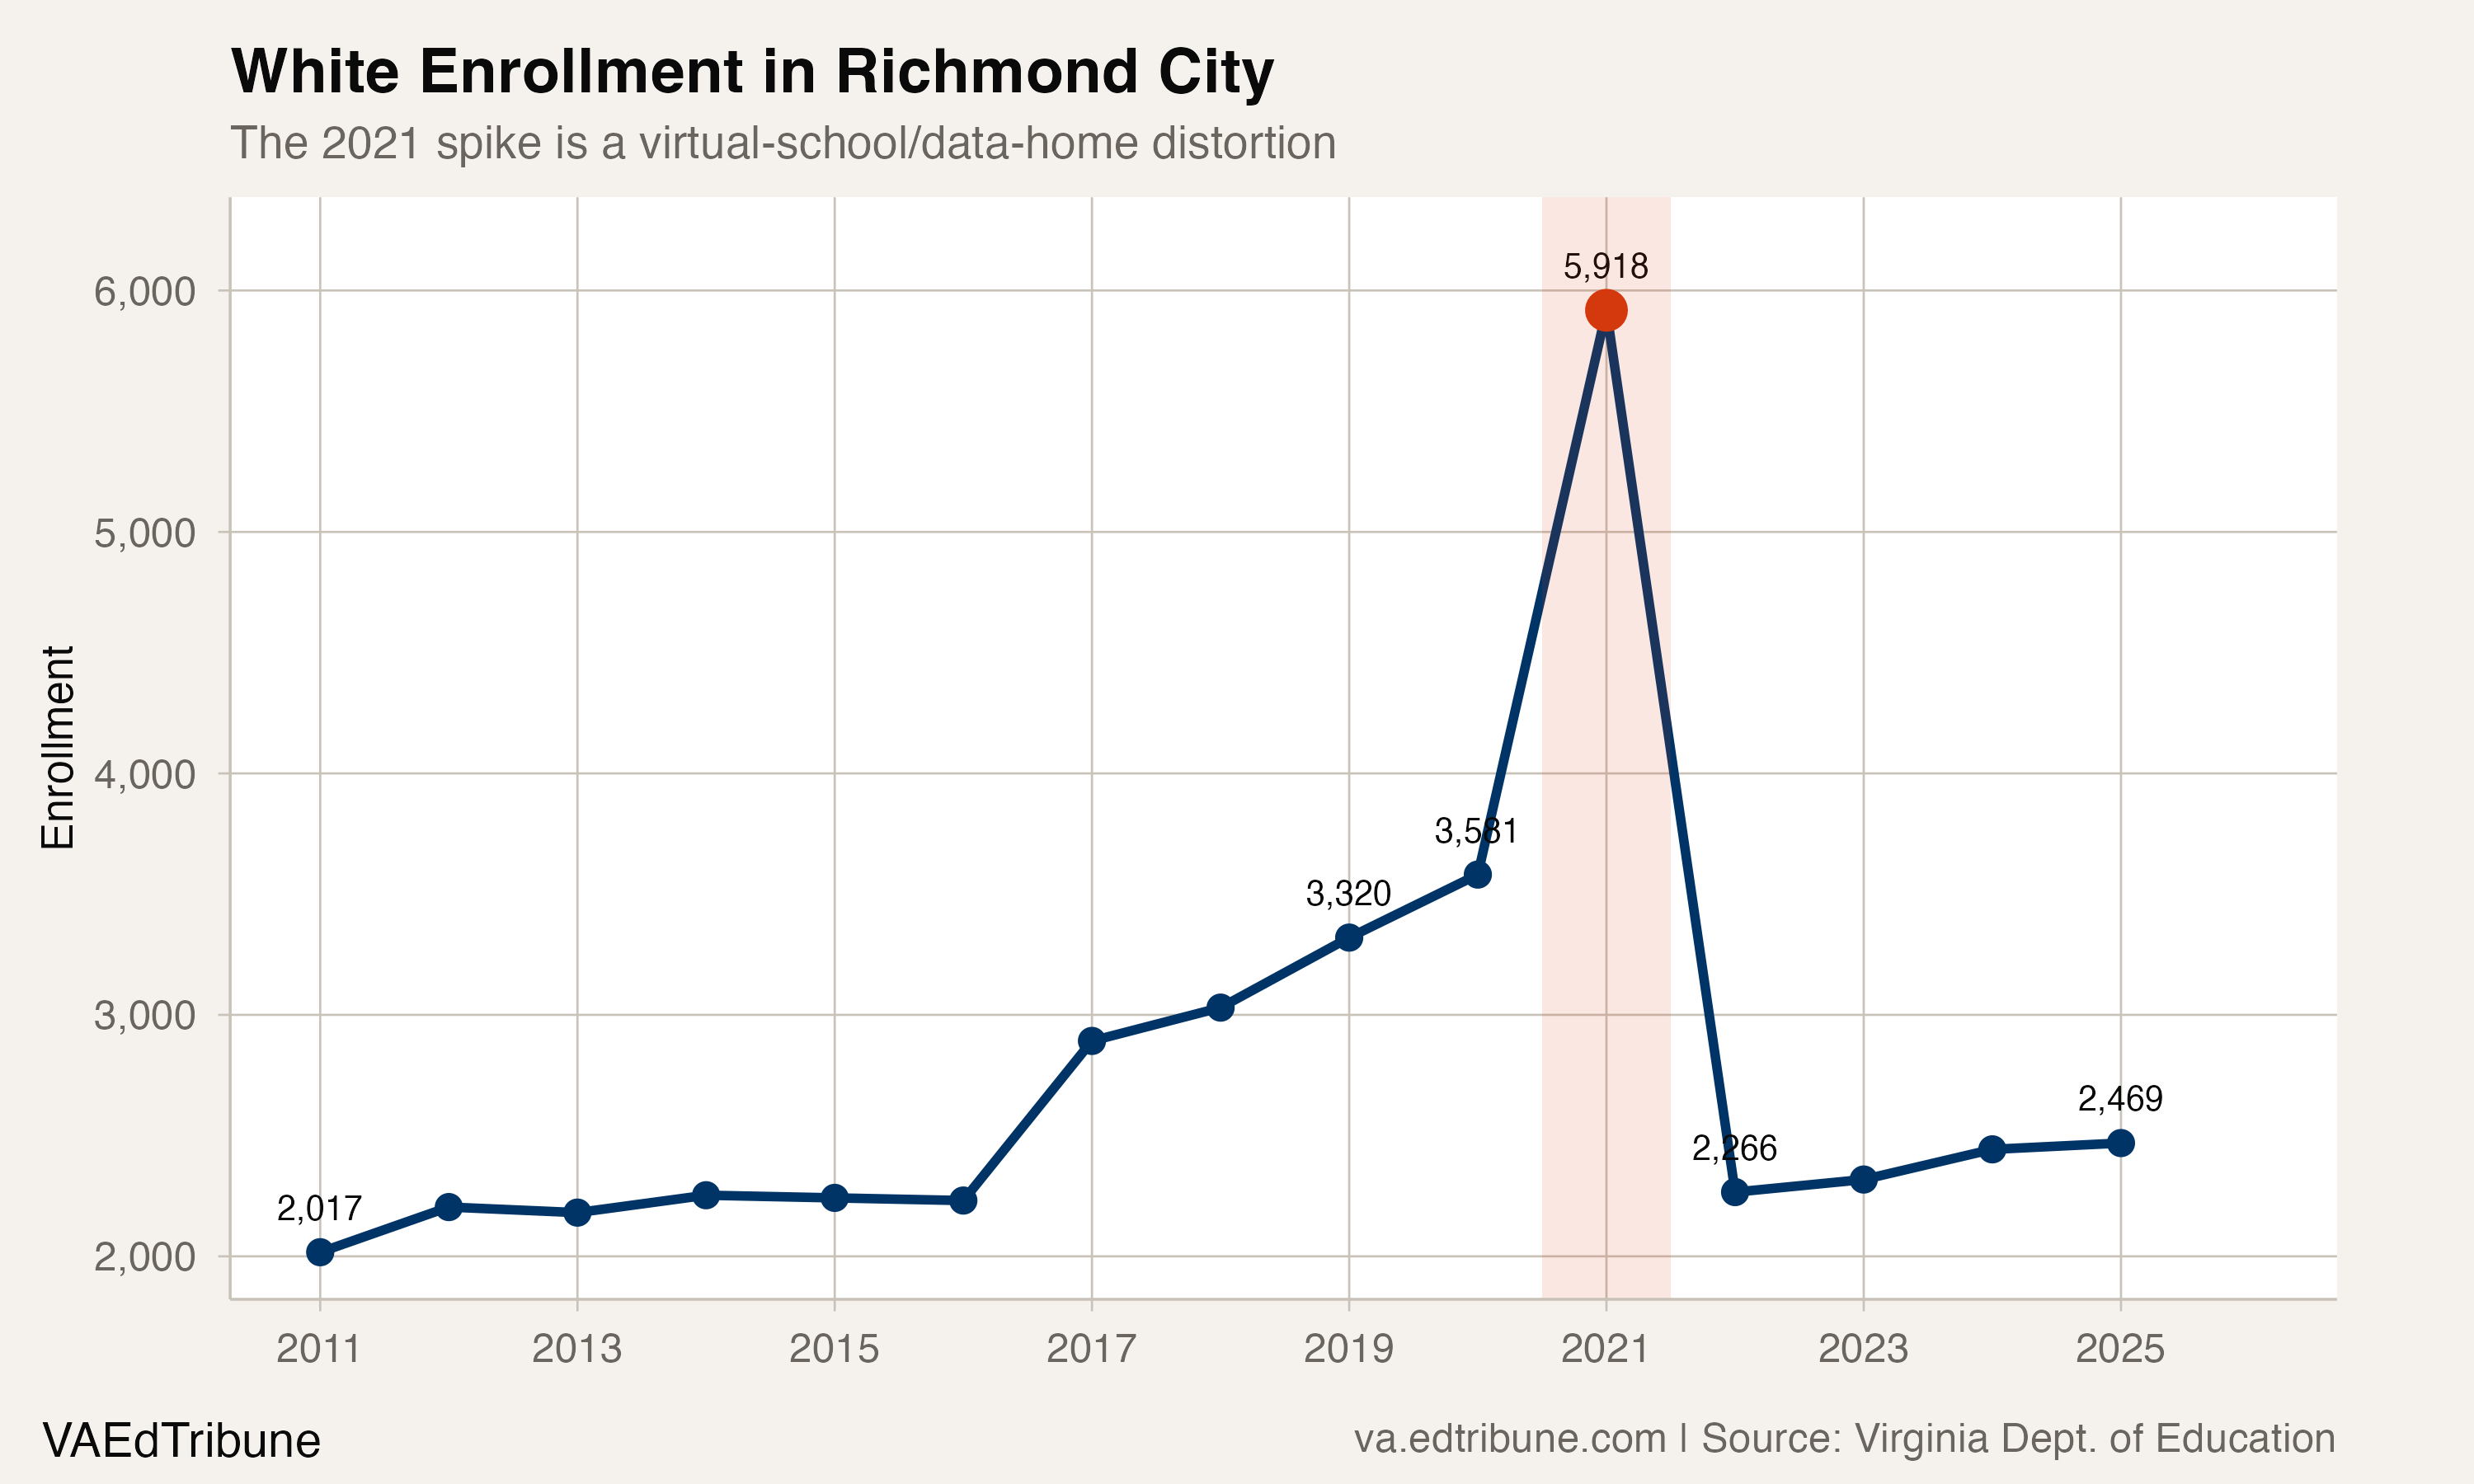
The 2021 race data should carry the same warning label as the total enrollment series. White enrollment jumped from 3,581 in 2020 to 5,918 in 2021, a 65.3% increase, then dropped to 2,266 in 2022. That does not mean Richmond's local white student population grew by two-thirds in a year. It means the virtual-school/data-home distortion also changed the demographic mix in the reported file.
The demographic story is clearer on either side of the virtual spike. Richmond remains a majority-Black school system, but Black enrollment has fallen every year since 2022, reaching 12,162 in 2025. That is down 38.2% from 19,675 in 2010-11. Hispanic enrollment moved the other way, rising from 1,529 students in 2010-11 to 5,865 in 2024-25.
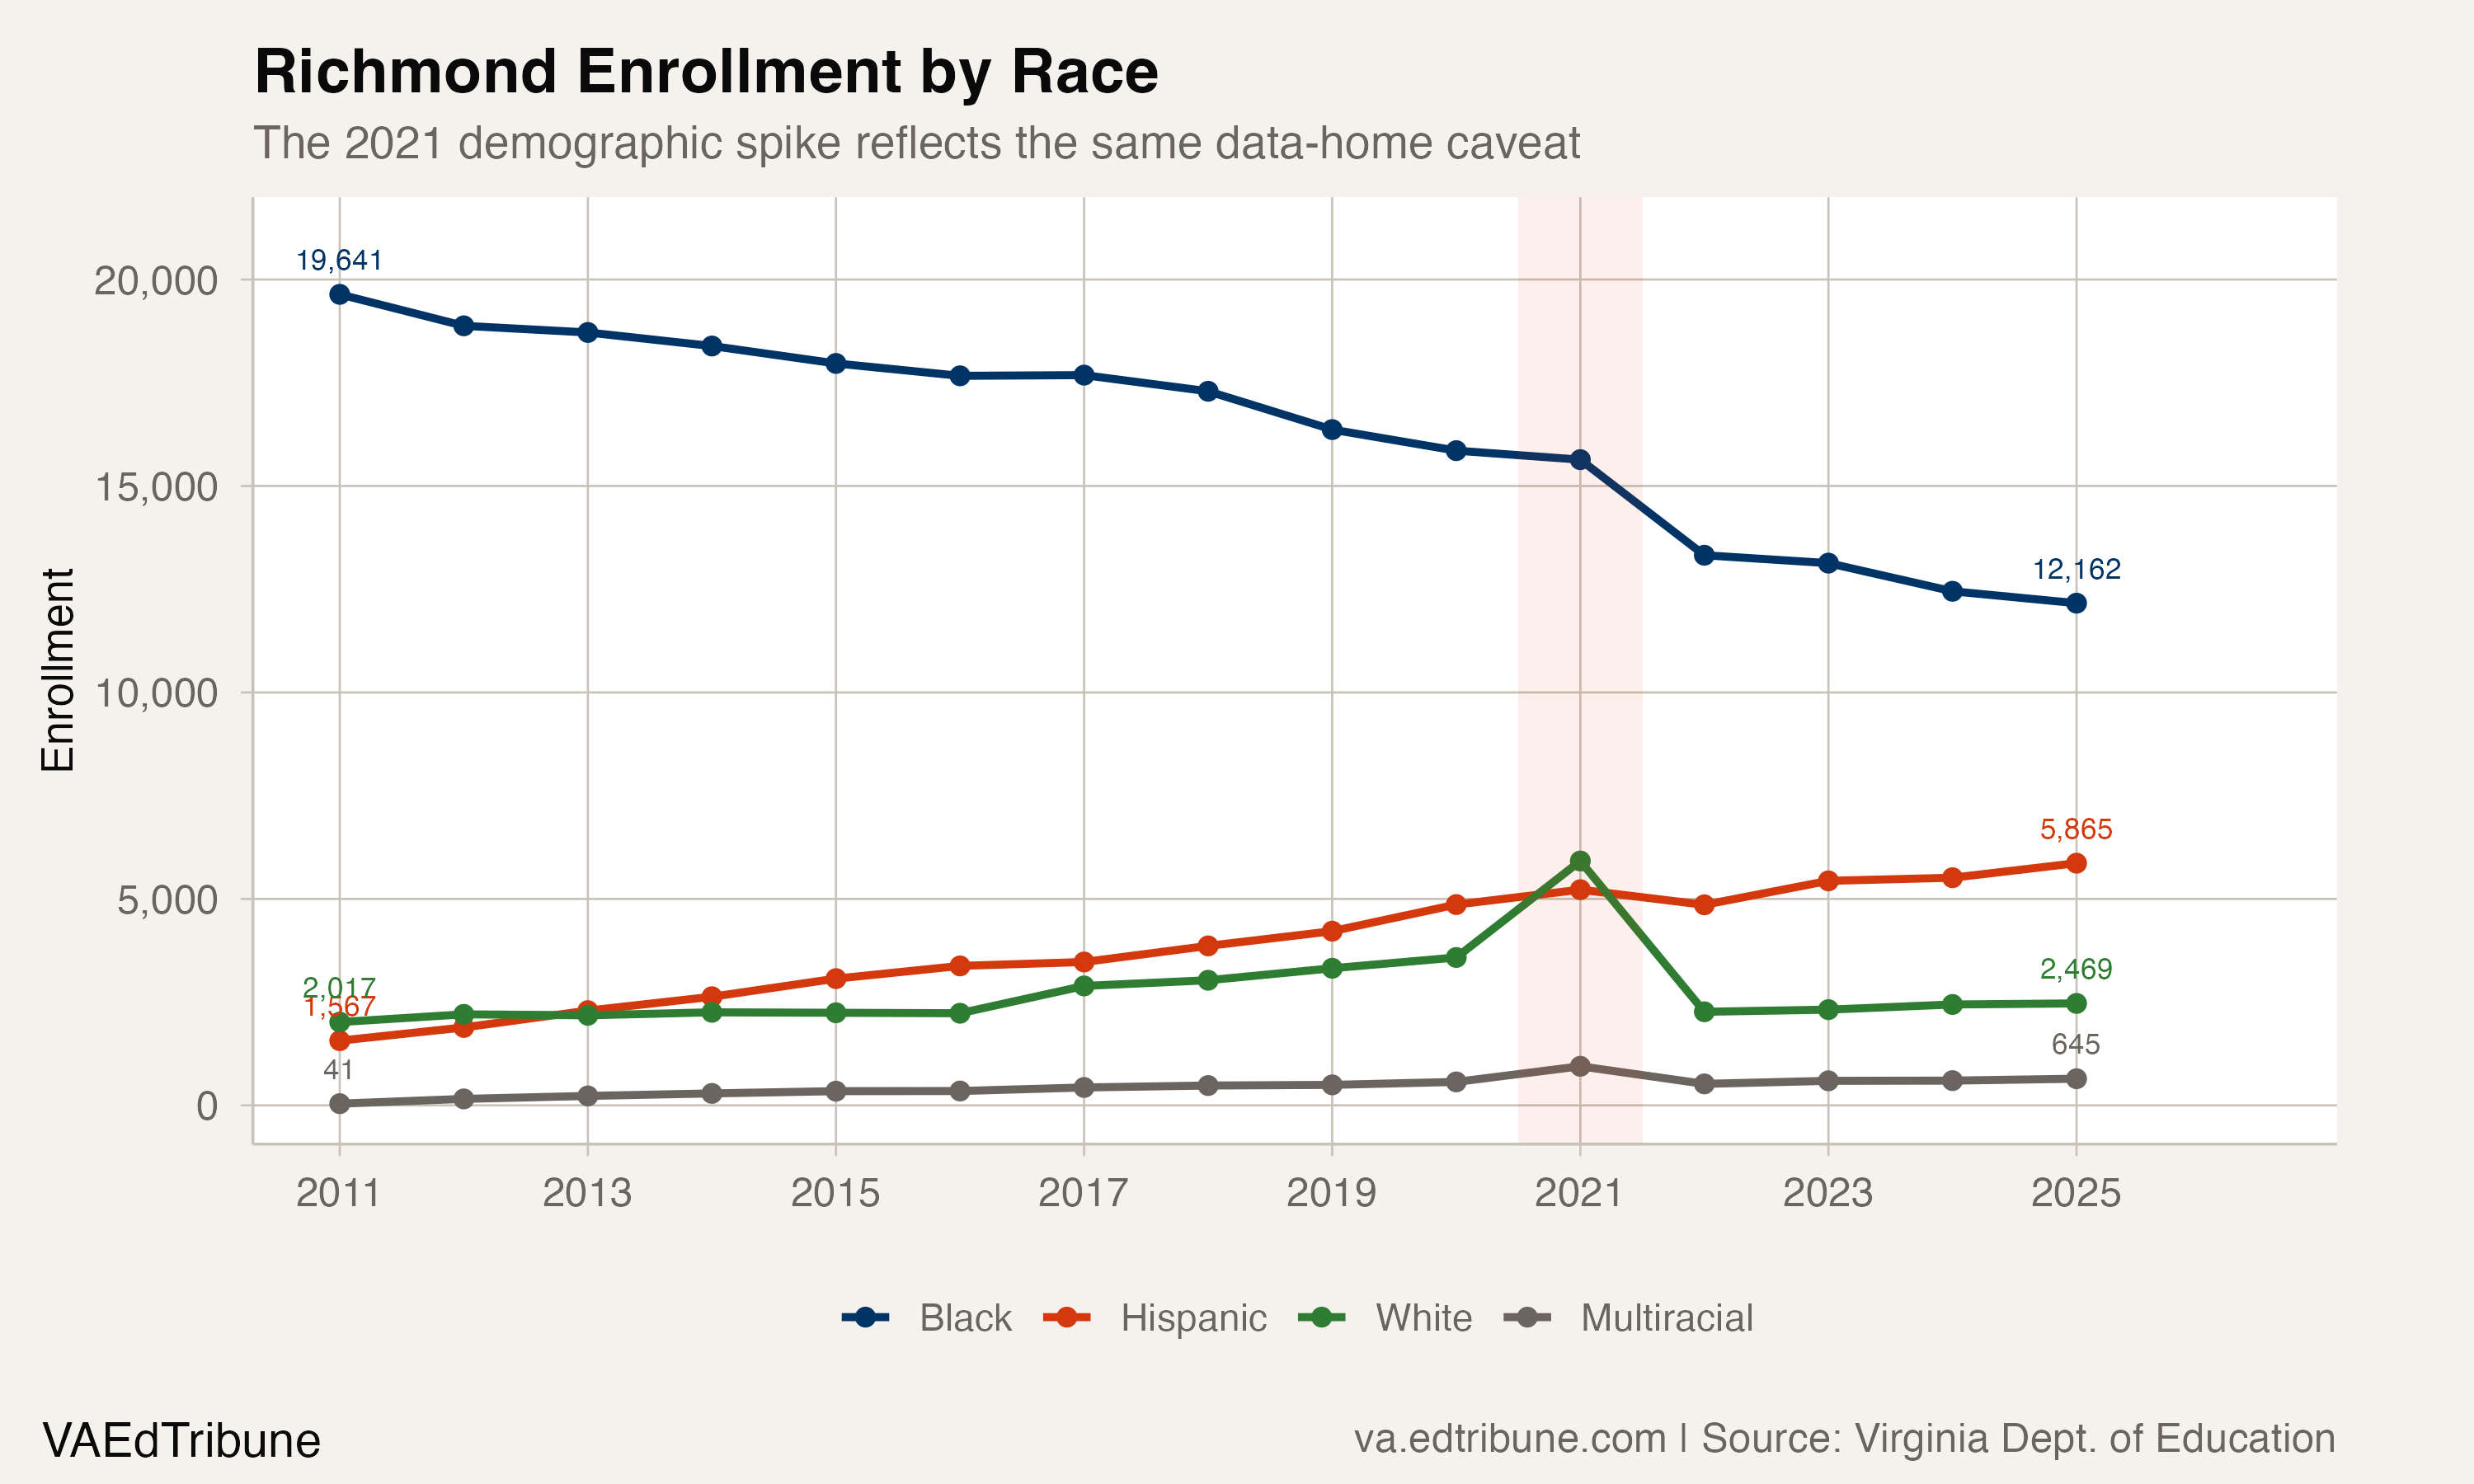
Black students made up 83.9% of Richmond's reported enrollment in 2010-11. By 2024-25, the share had fallen to 56.8%, a drop of 27.1 percentage points in 14 years. The Hispanic share more than quadrupled, from 6.5% to 27.4%, over the same span. More than one in four Richmond students is now Hispanic, and 21.8% of students are classified as limited English proficient.
Suburbs up, city down
The regional comparison still shows the same broad divide. Since 2003, Chesterfield County↗ET has added 10,248 students (+19.0%), reaching an all-time high of 64,254 in 2025. Henrico County↗ET added 7,218 students (+16.5%) and peaked at 51,786 in 2020.
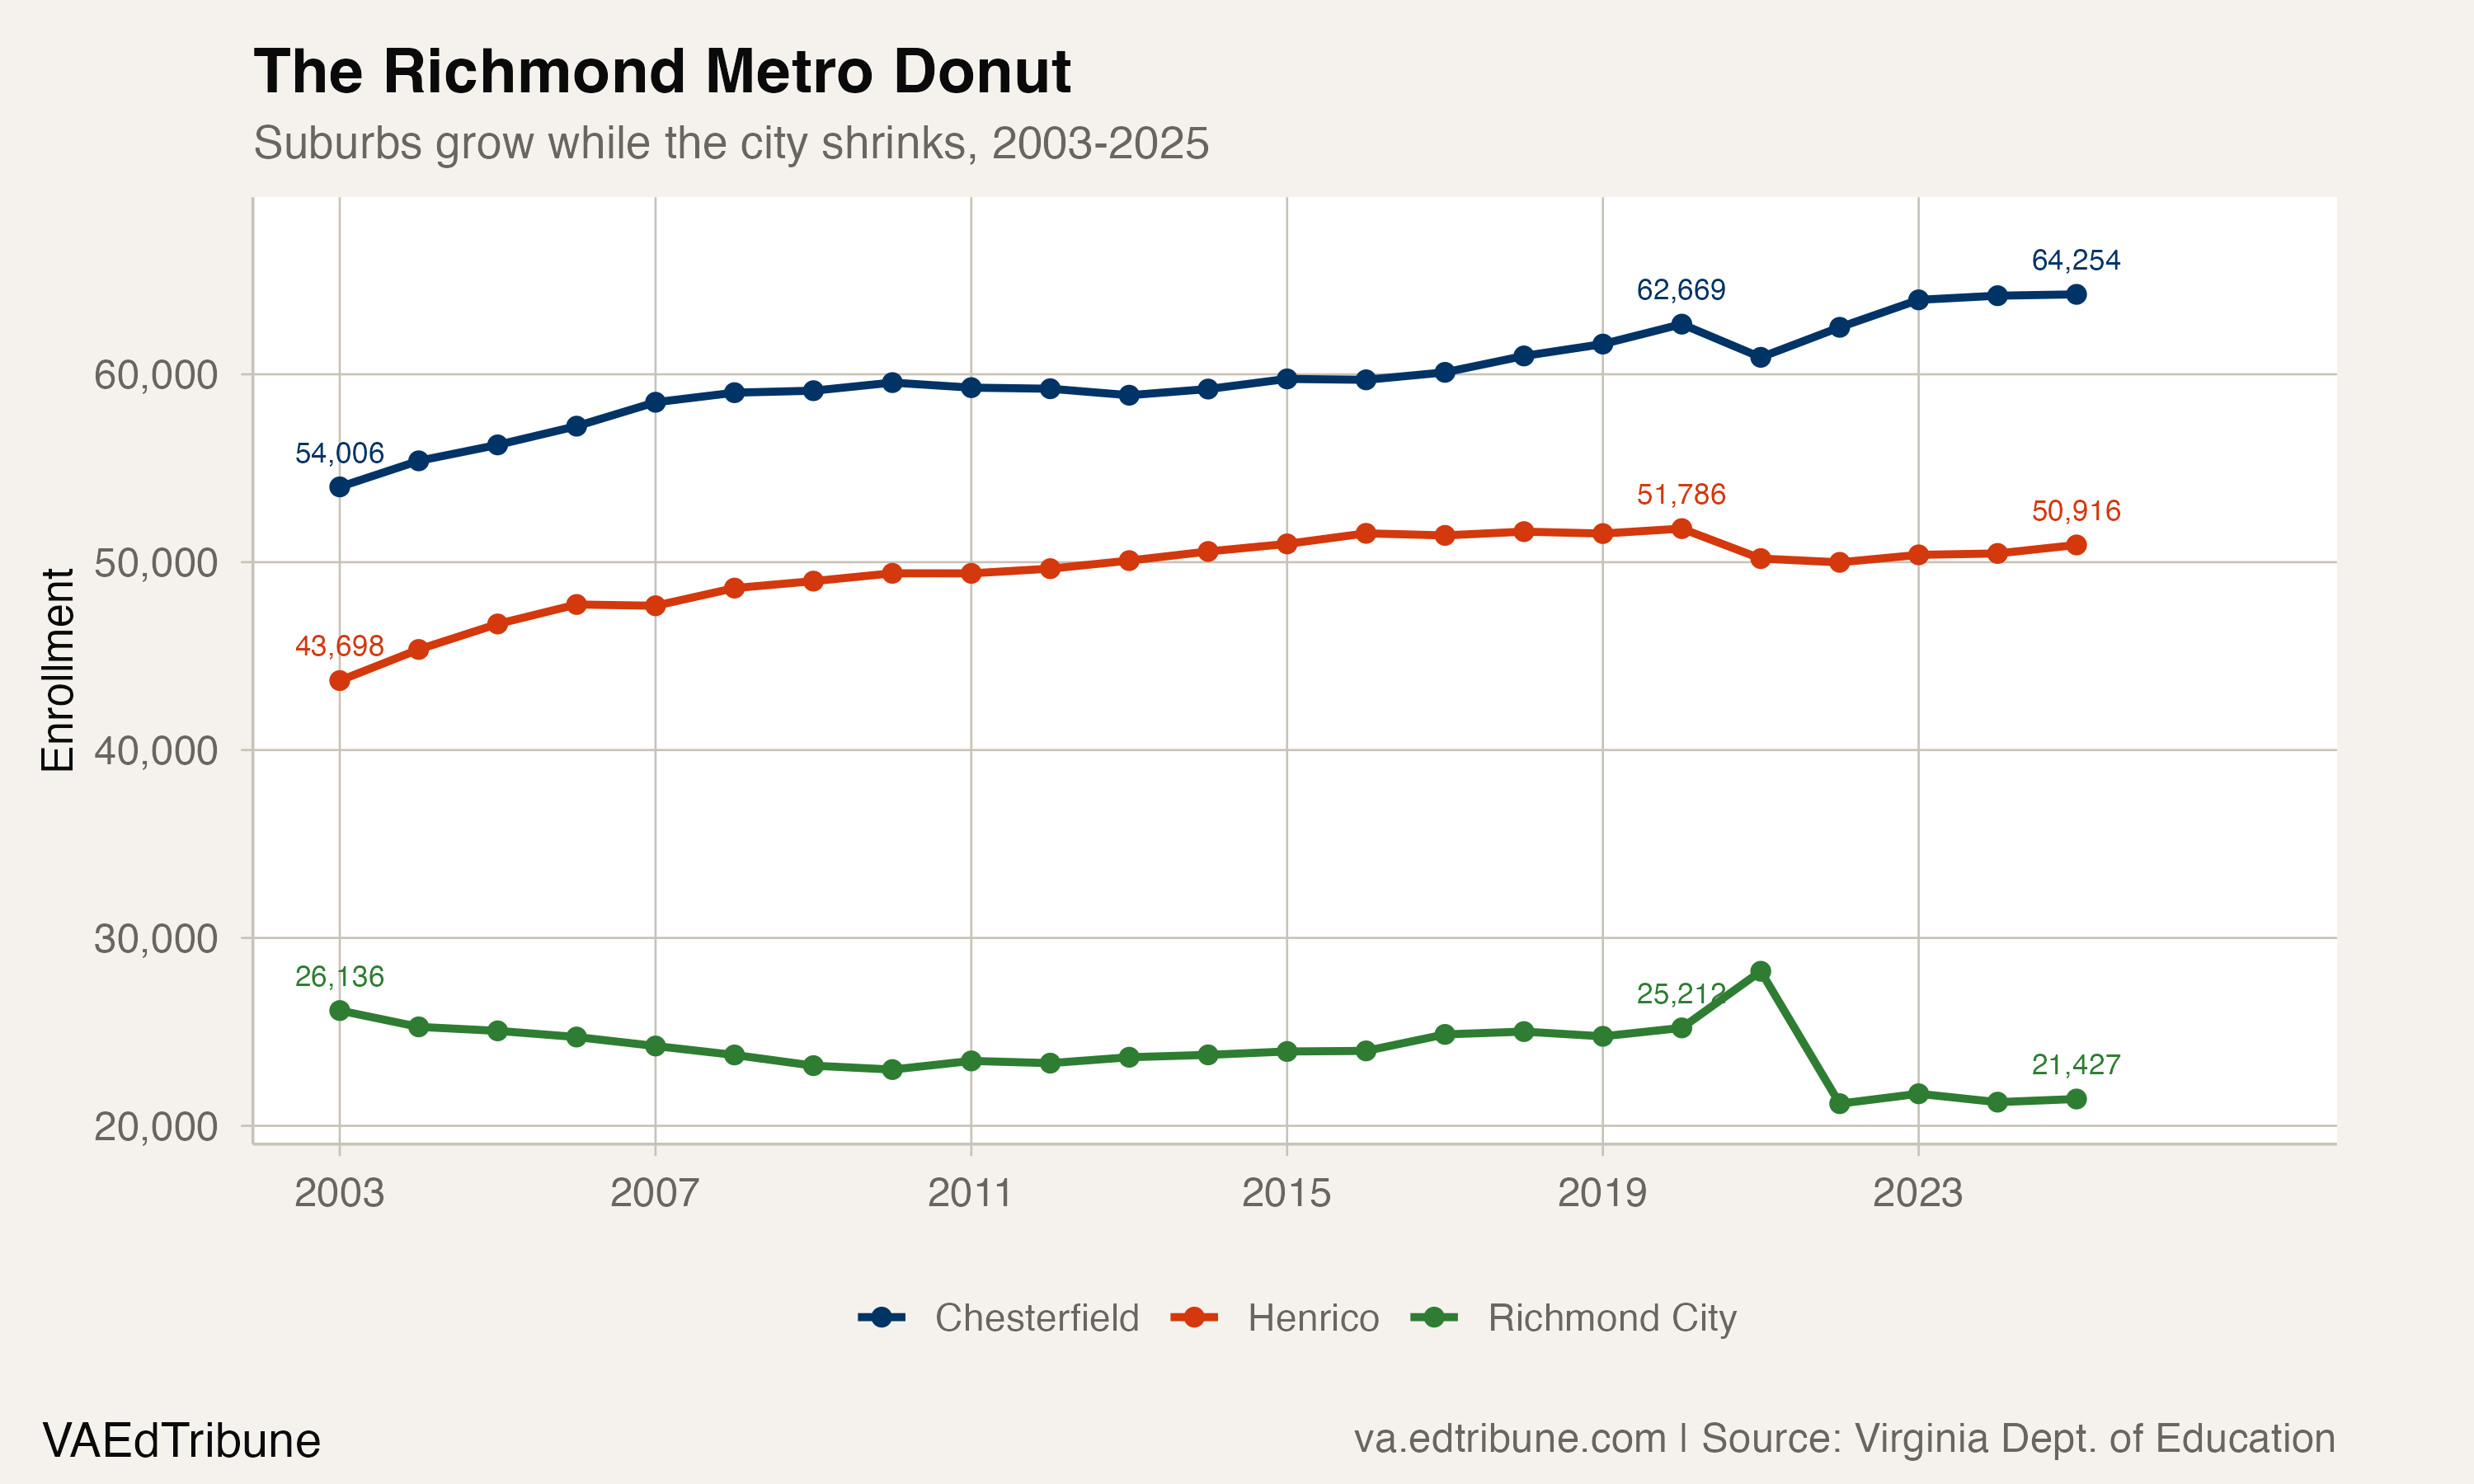
Richmond's share of the three-division metro has shrunk from 21.1% in 2003 to 15.7% in 2025. Chesterfield is now three times Richmond's size. Chesterfield registered the largest population increase among all 133 Virginia jurisdictions from 2020 to 2025, and the county is on the verge of eliminating classroom trailers for the first time in 30 to 40 years after adding 8,779 school seats through a bond referendum.
The divergence is not just about total numbers. Census data shows Richmond's school-age population shrank from roughly 38,000 in 2000 to fewer than 30,000 by 2020. The Richmond Free Press reported that a school board member summarized the situation as "we've lost a lot of customers."
The Pressures Are Local, Too
Public evidence points to several pressures rather than one clean cause. Census counts show the number of school-age residents in Richmond fell by roughly 8,000 between 2000 and 2020. Competition from outside the public system may also play a part, though the state's enrollment files cannot show how many Richmond families chose it. Virginia's homeschool population has grown nearly 50% since the pandemic, with more than 66,000 students now homeschooled statewide. Private school enrollment across Virginia increased 20% since 2021-22 to 123,861 students. Richmond-area homeschool numbers rose from 4,220 to 5,541 between 2019 and 2022.
The budget stakes are concrete. On June 2, 2026, Richmond Public Schools approved a FY2027 budget that finalized the closure of Richmond Virtual Academy, an online program the district said cost about $3.2 million to run. Earlier in the budget process, Superintendent Jason Kamras told the School Board that expenses were expected to rise by at least $31 million while added state and city funding was expected to grow by $12 million.
"Highly regrettable reductions, but I'm trying to make the numbers work." -- Superintendent Jason Kamras, The Richmonder, January 2026
What To Watch Next
The cleanest forward-looking signal is the early-grade pipeline, where the VAVA caveat matters less than it does for total division headcount. Richmond's kindergarten enrollment fell from 2,066 in 2018-19 to 1,723 in 2024-25, a 16.6% drop. Pre-K enrollment fell from 1,667 in 2019-20 to 1,073 in 2024-25.
Richmond's enrollment officials have pointed to outreach as a counterweight. The division celebrated a 168-student increase in 2024-25, crediting intensified contact with families of preschoolers. The next test is whether that outreach keeps the post-2022 stability from turning into another decline as smaller kindergarten and Pre-K cohorts move through the system.
Detailed code that reproduces the analysis and figures in this article is available exclusively to EdTribune subscribers.
Discussion
Sign in to join the discussion.
Loading comments...