Correction (July 21, 2026): A July 3 fact-check corrected multiracial students' 2011 rank from second-smallest to third-smallest but did not add the required visible notice. This audit also found that annual gains did not settle into a 2,500-to-3,000-student range after 2012. Excluding the 2017 spike, they ranged from 655 to 3,687, with a median of 2,583. This version corrects that description and removes explanations for the spike and local patterns that the enrollment file cannot test.
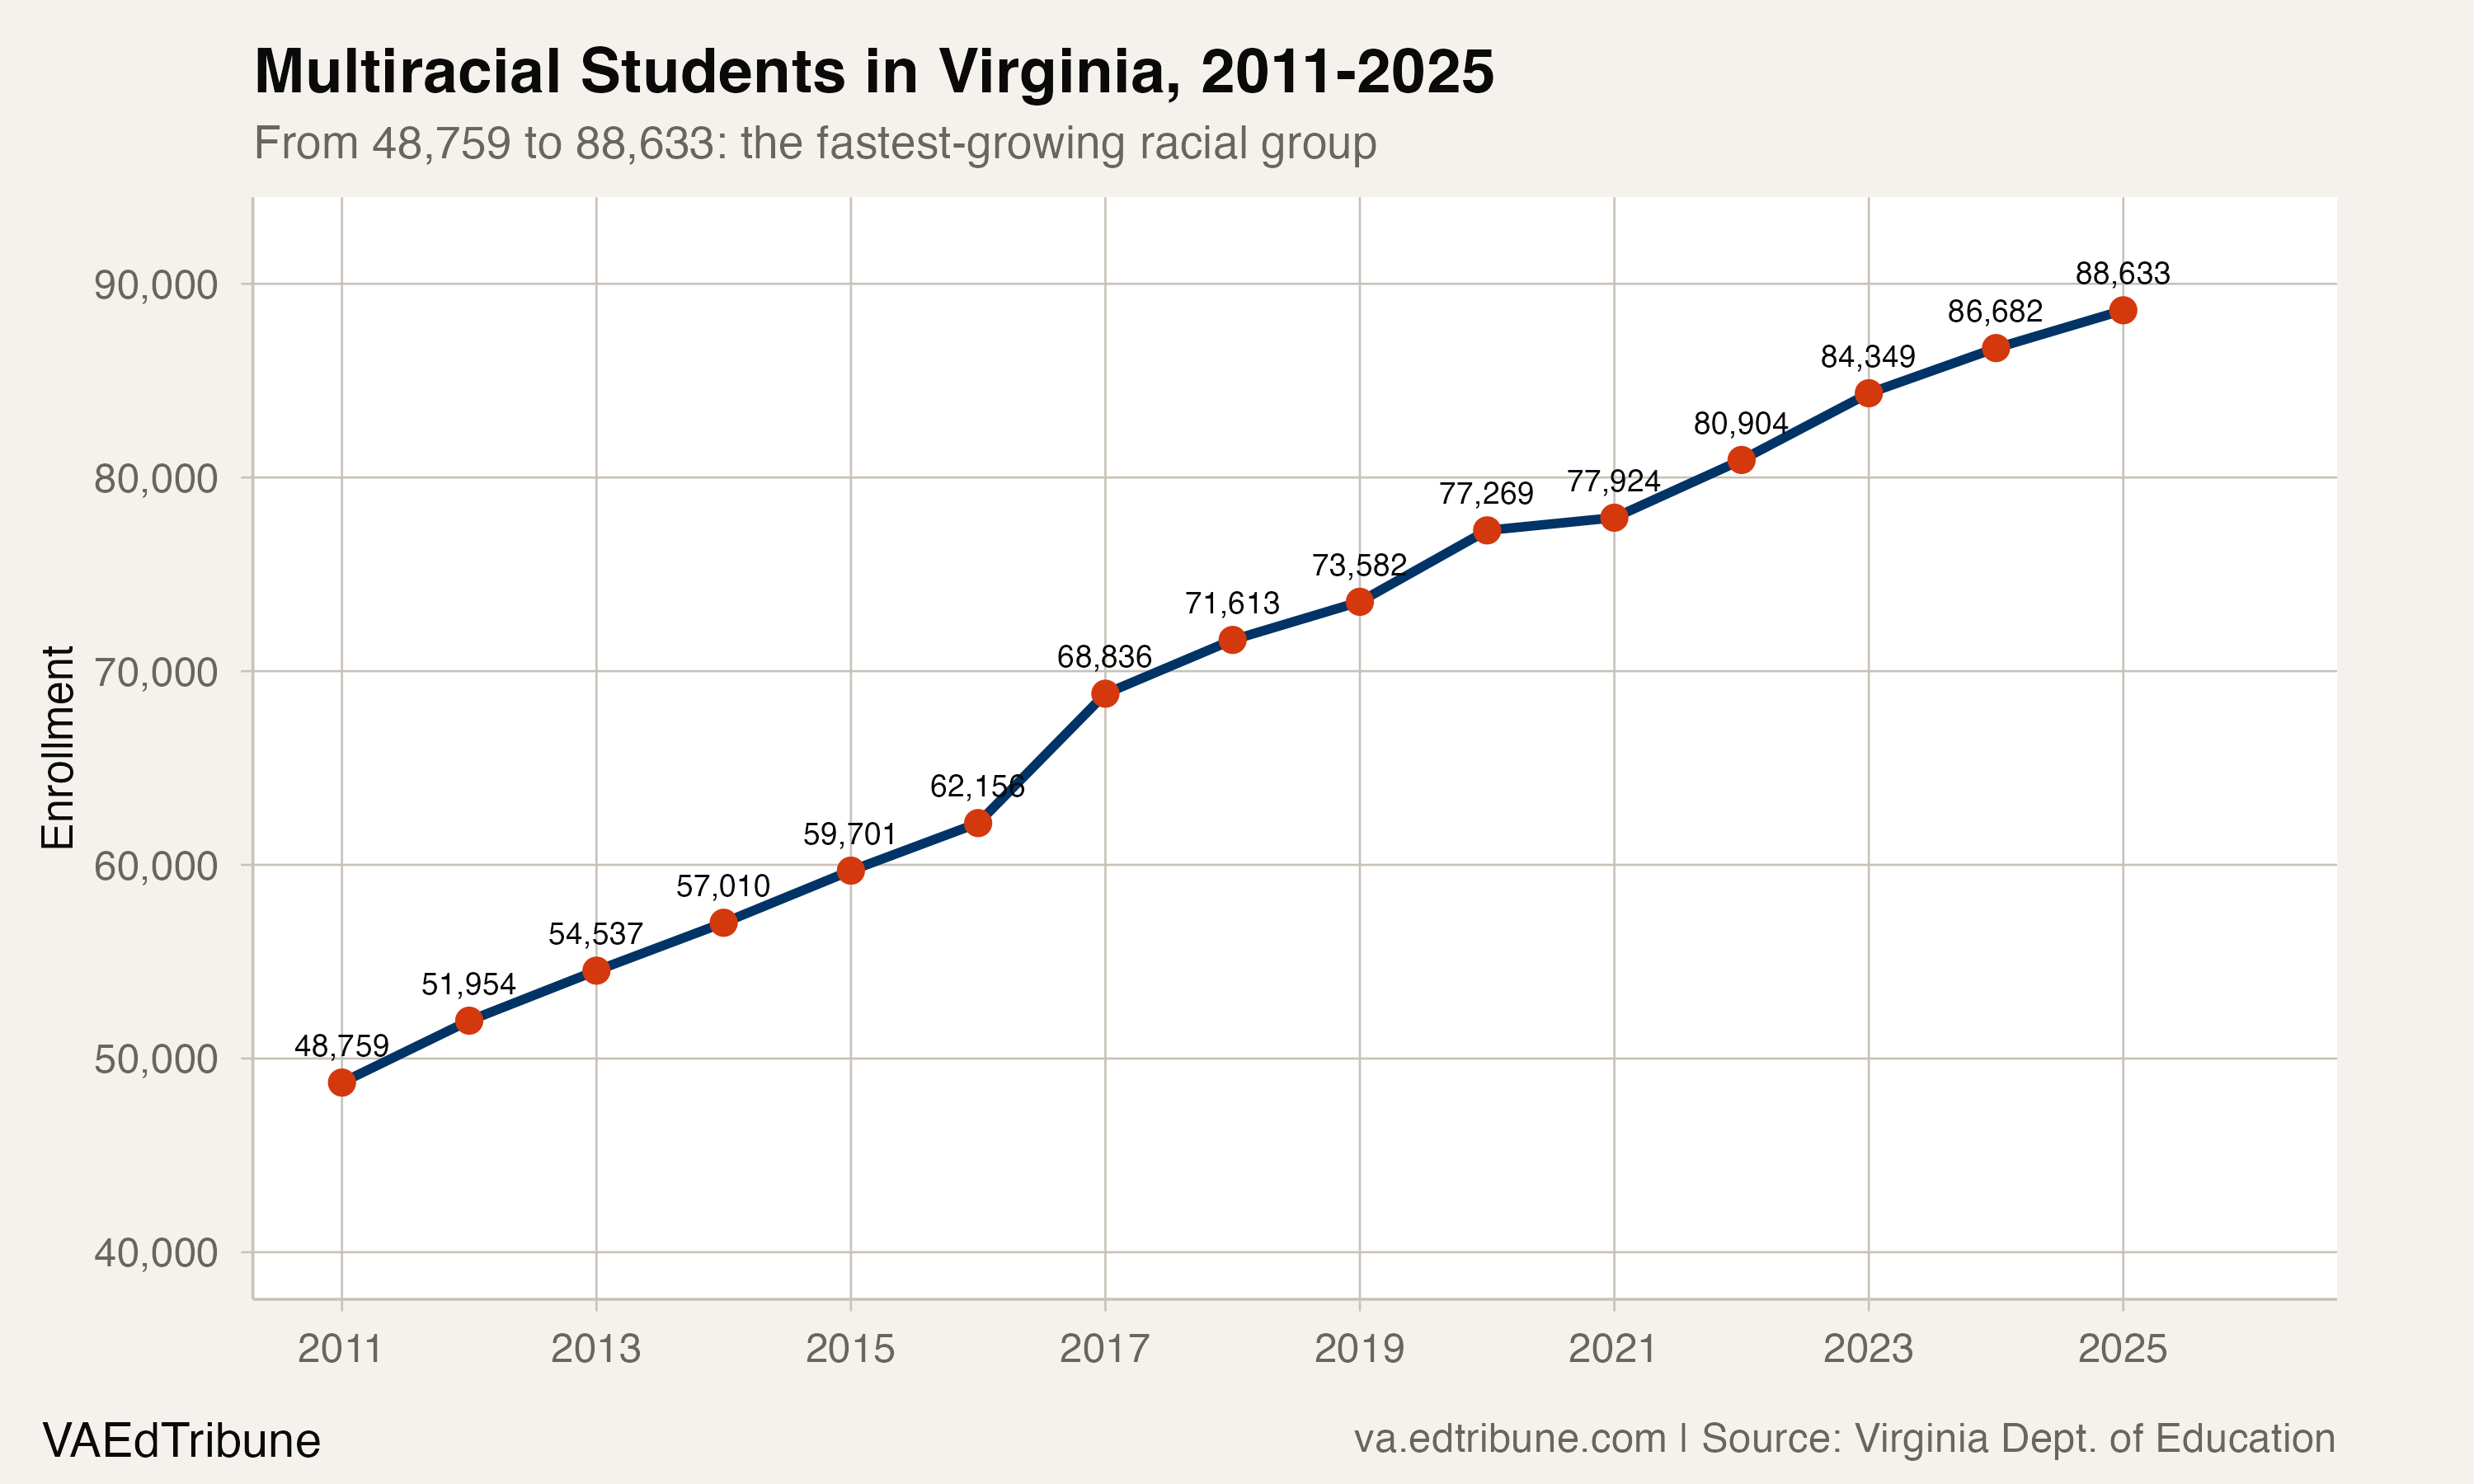
In 2010-11, the first year Virginia reported a "two or more races" category, 51,214 students were counted in it. By 2024-25, the most recent school year in the state's published data, 88,643 were. That 73.1% increase is the second-fastest growth of any racial group in the commonwealth, behind Hispanic enrollment (+77.9%) and well ahead of Asian enrollment (+34.1%). Virginia's multiracial share is now 7.0%, about one student in 14.
The group added an average of 2,674 students per year. Its count rose in every year of the series; no other reported racial group did.
The category that barely existed
Virginia's series begins in 2010-11. The U.S. Department of Education's implementation guide for its 2007 race and ethnicity guidance required education institutions to let respondents select one or more races by fall 2010 for reporting in the 2010-11 school year.
Multiracial enrollment grew 6.7% from 2010-11 to 2011-12. Annual additions after that varied, from 655 students in 2020-21 to 3,687 in 2019-20, with a median of 2,776. No single year stands out as a break in the series.
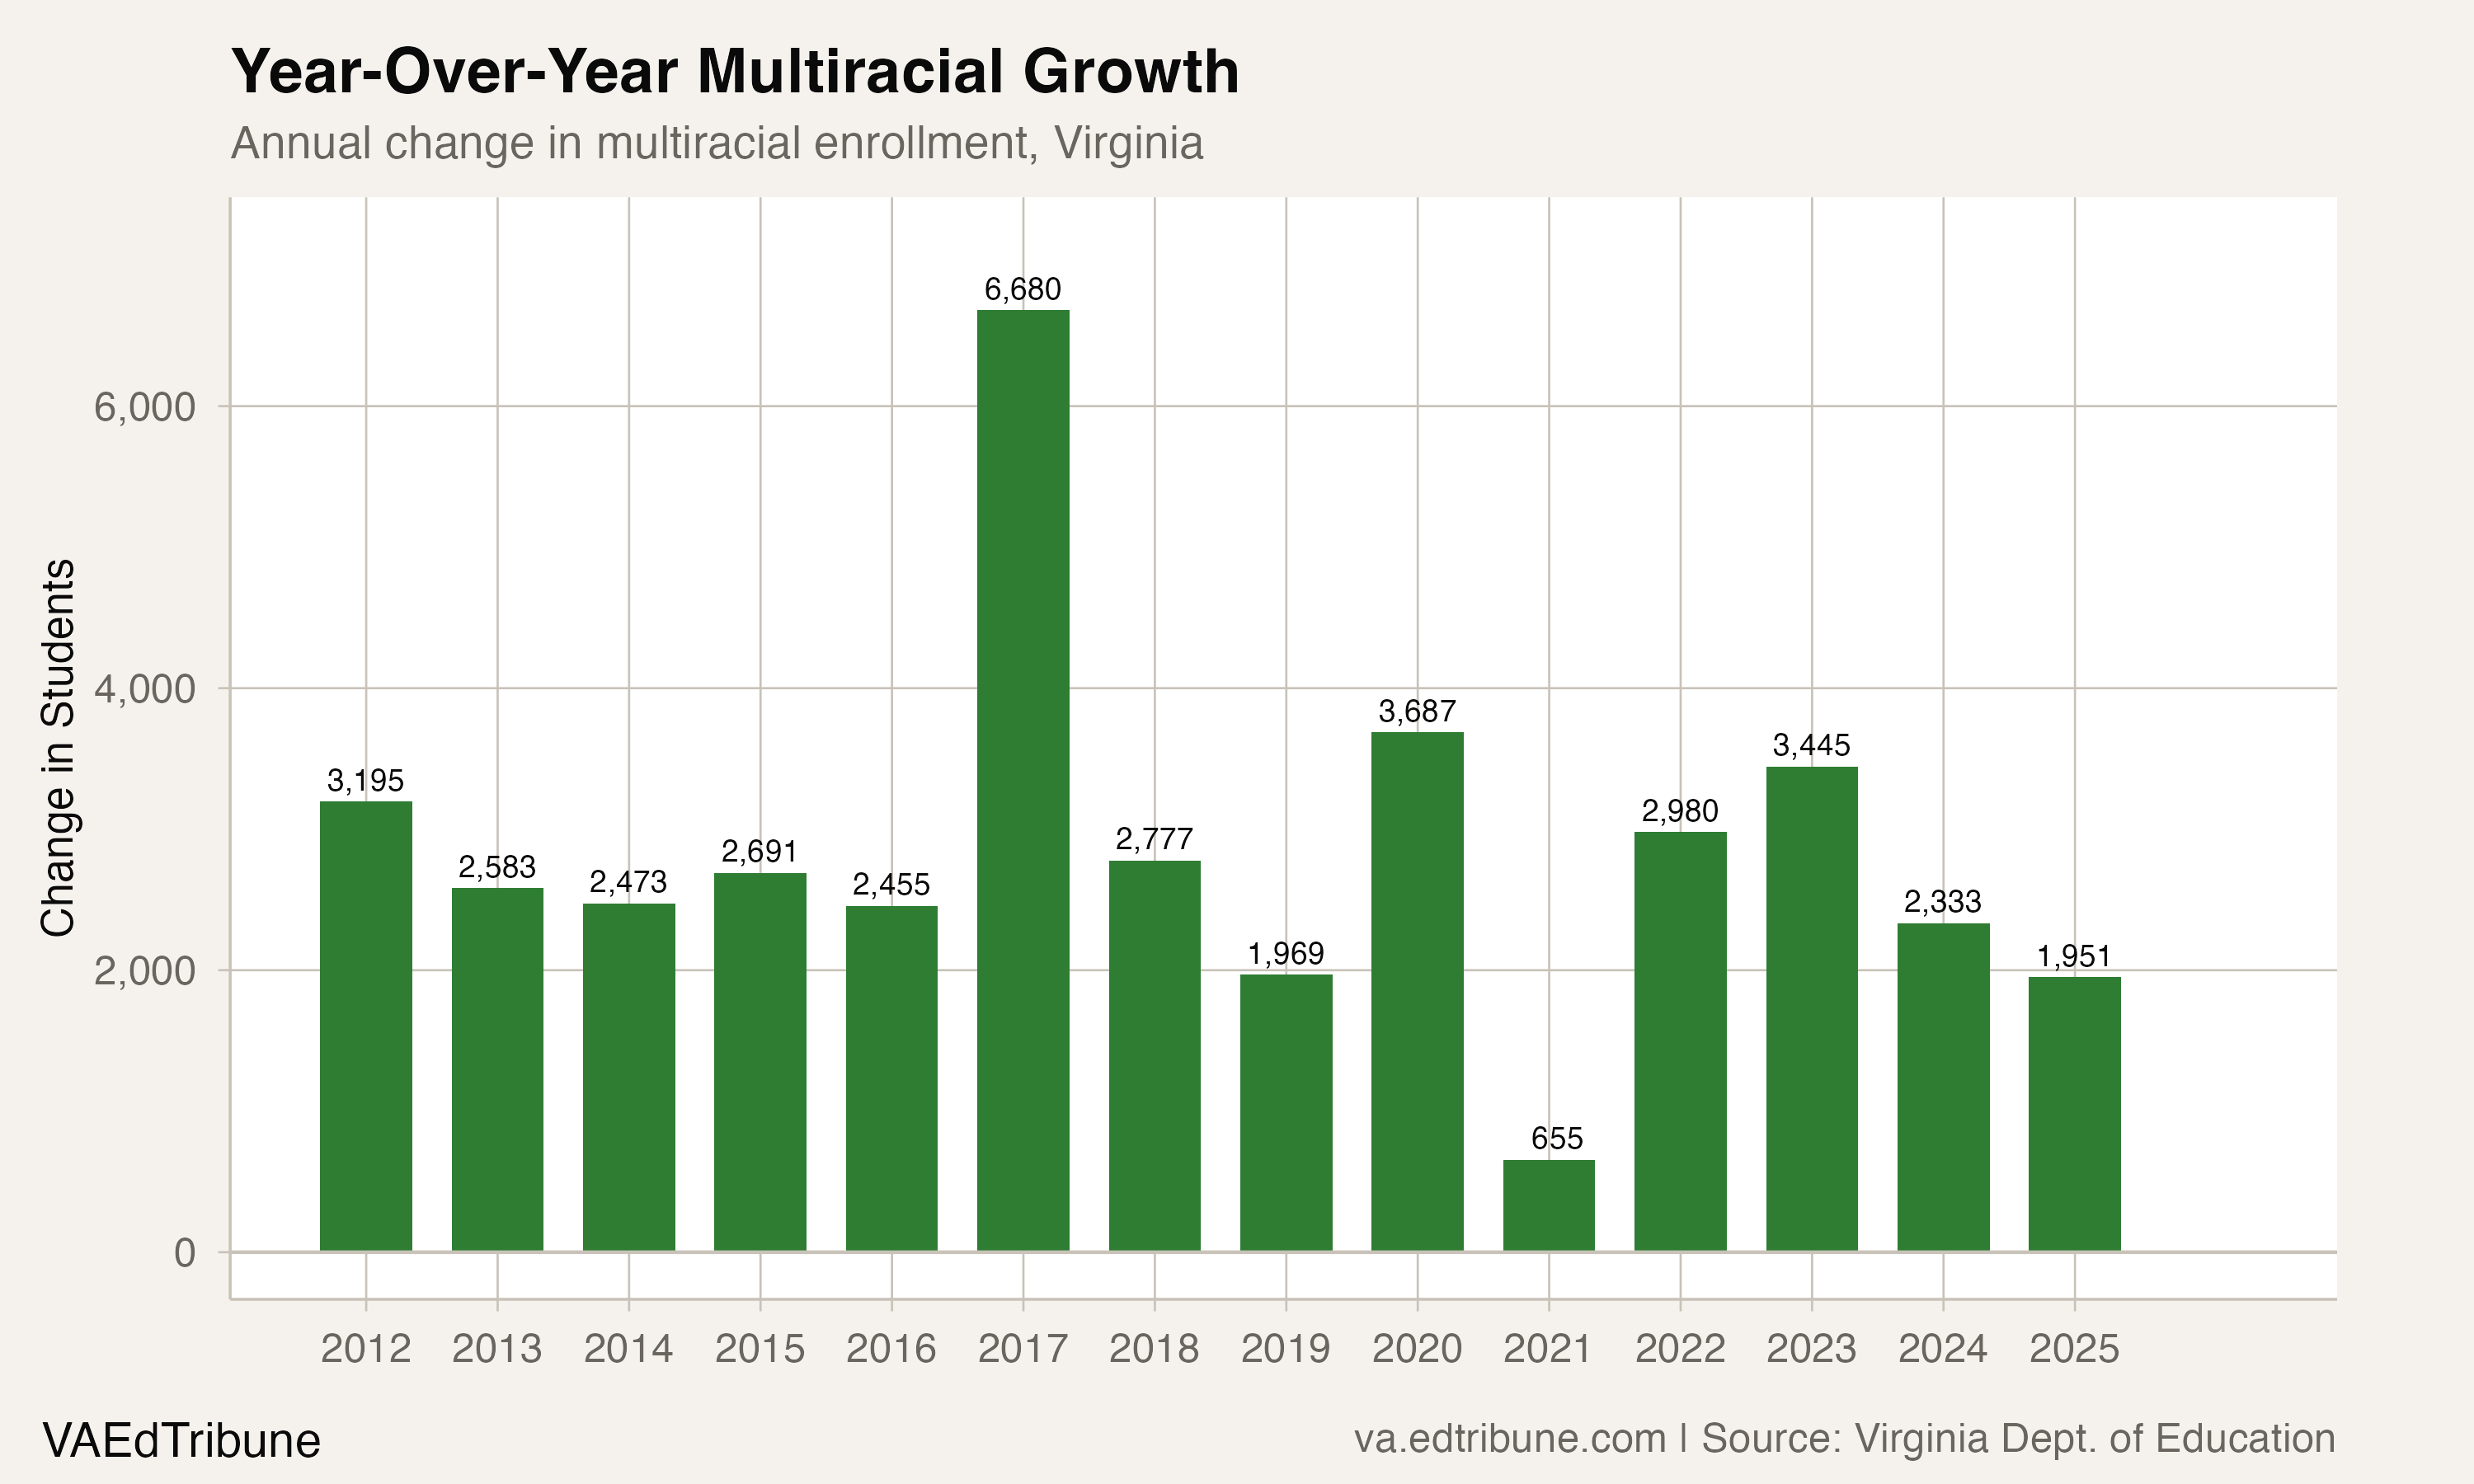
From 2019-20 to 2020-21, total Virginia enrollment fell by 45,331 students while multiracial enrollment grew by 655. Every other reported racial group, including Hispanic students, lost enrollment that year.
Two forces, one trend line
Not all of this growth represents new children walking through schoolhouse doors. The data reflects both genuine demographic change and reclassification effects, and cannot cleanly separate them.
National evidence shows that demographic change is one possible contributor. A Pew Research Center analysis of Census Bureau data found that one in seven U.S. infants in two-parent homes in 2015 was multiracial or multiethnic, nearly triple the 1980 share. That national statistic does not measure Virginia public school students or establish how much of this series reflects births.
Classification is another possible contributor. Research published in the Russell Sage Foundation Journal found that most of the 276% national increase in multiracial identification between the 2010 and 2020 censuses stemmed from Census data-processing changes, while also finding natural growth across birth cohorts. That result concerns Census processing, not Virginia's school-enrollment system.
The state enrollment file does not contain birth, parent-race, form-response or student-level reclassification histories. It therefore cannot assign a share of Virginia's increase to either mechanism.
Where the growth is concentrated
Multiracial share increased in 127 of Virginia's 131 divisions, but the concentrations vary.
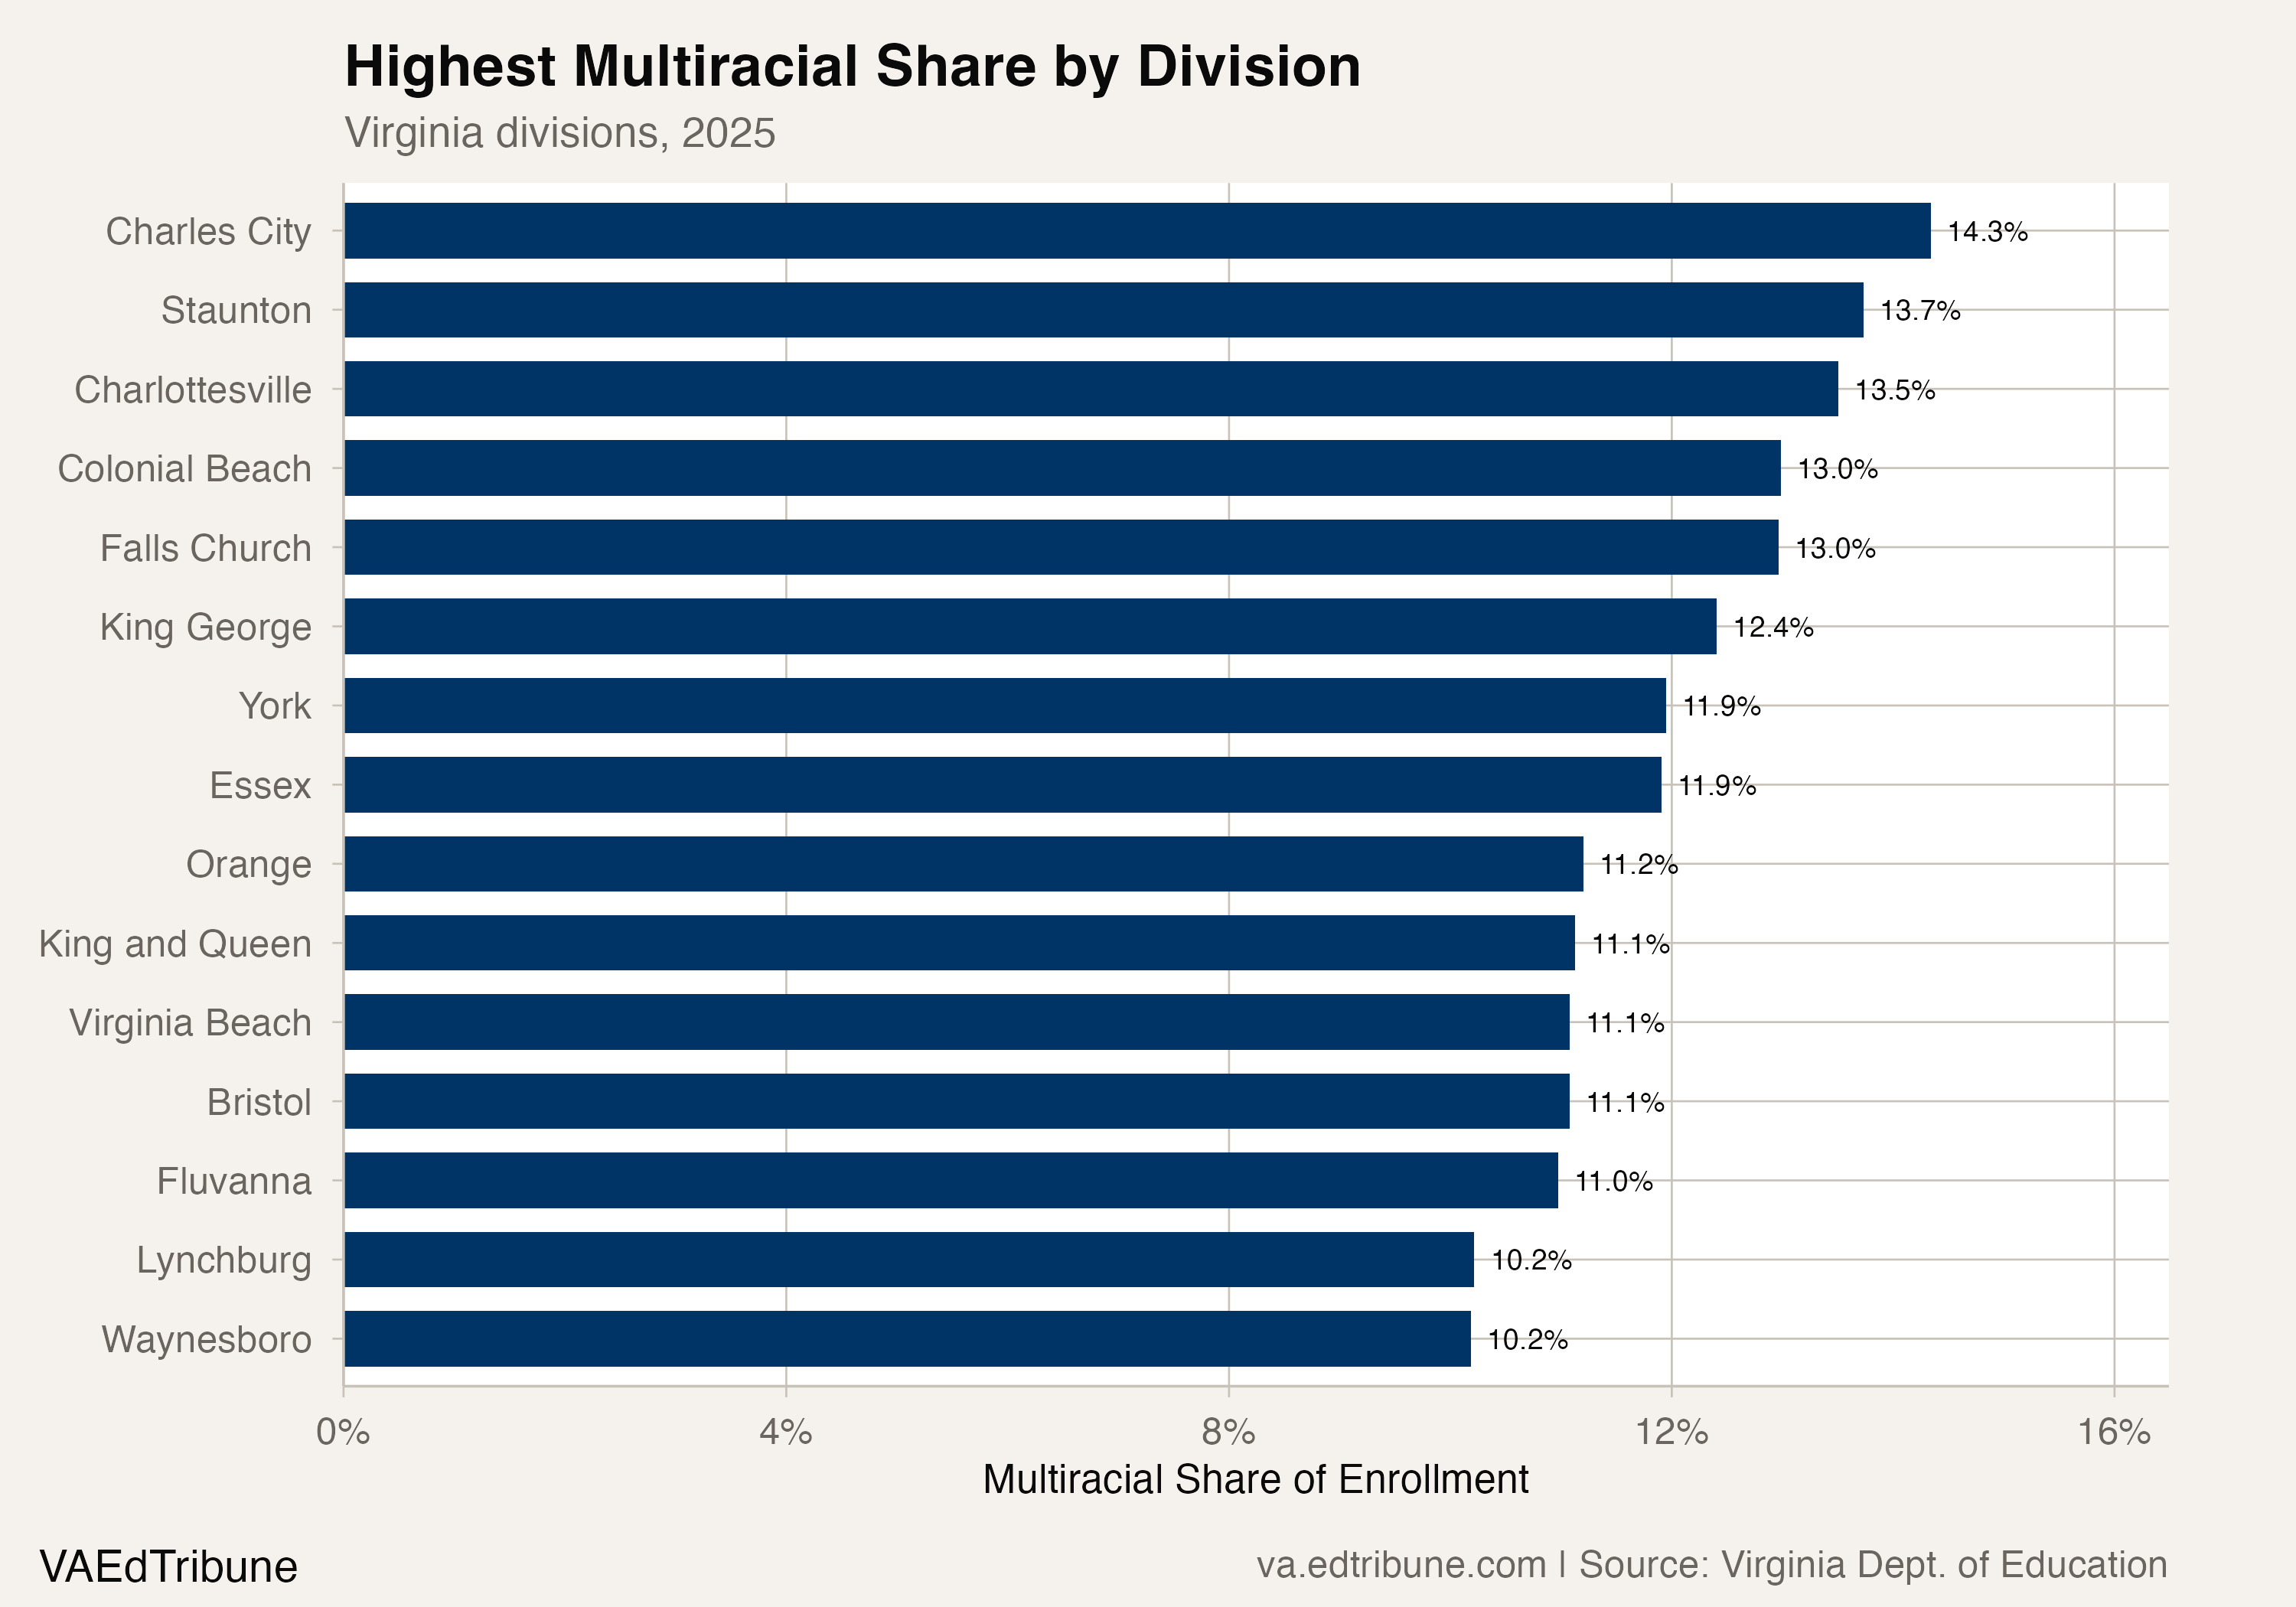
Several divisions with high shares also hold Virginia Purple Star status, a designation for systems whose schools support military-connected families. That is context, not evidence that military connection caused the enrollment pattern. York County↗ET, which the Virginia Department of Education lists as a Purple Star division, has an 11.9% multiracial share. King George County↗ET went from 3.5% to 12.4%, an 8.9-percentage-point increase. Virginia Beach↗ET sits at 11.1%.
Charlottesville↗ET went from 3.7% to 13.5% multiracial, a 9.8-percentage-point increase. Falls Church↗ET went from 3.9% to 13.0%.
In absolute numbers, Fairfax County↗ET added the most multiracial students: 3,698, bringing its total to 11,575. Fairfax's 6.4% multiracial share trails the state average. The biggest percentage-point jump belongs to Charles City County↗ET, a small rural division between Richmond and Williamsburg that went from 0.5% to 14.3% multiracial.
Closing in on Asian enrollment
In 2010-11, multiracial students were the third-smallest racial group in Virginia, ahead of only Pacific Islanders and Native Americans. By 2024-25, they had closed the gap with Asian enrollment from 4.1% versus 5.8% to 7.0% versus 7.8%.
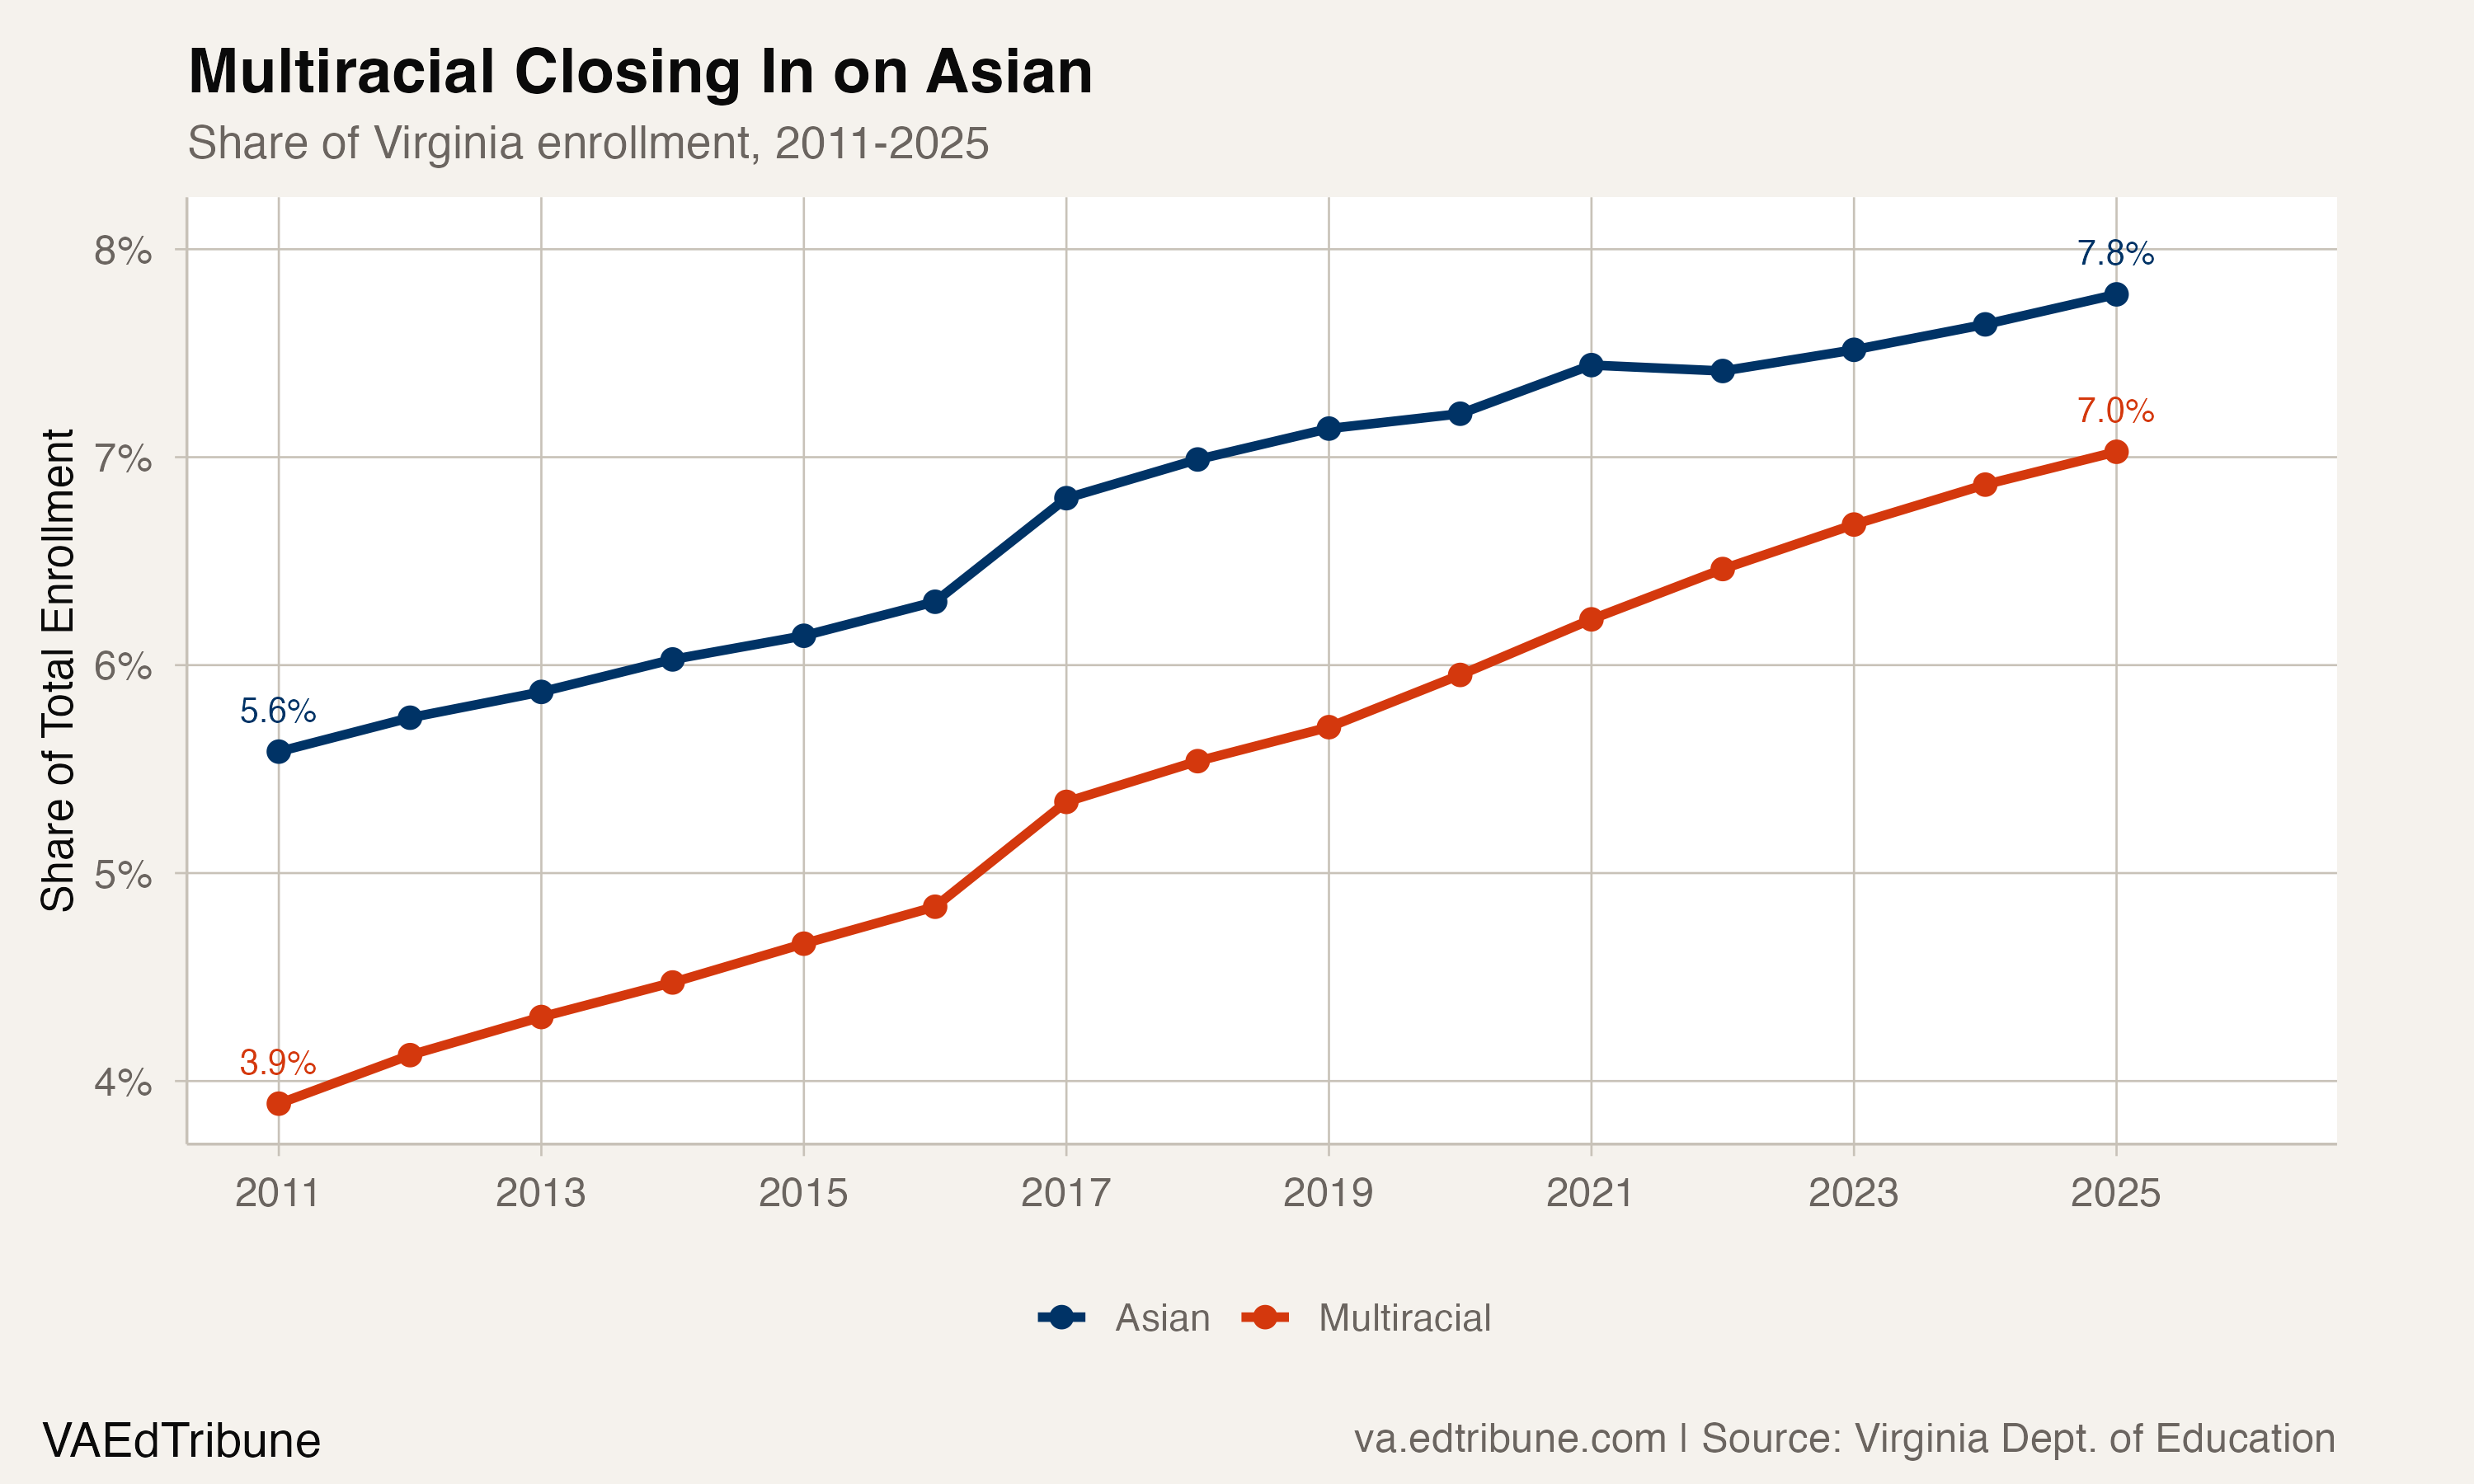
If the average annual gain since 2021-22 continued unchanged, multiracial enrollment would first top 100,000 students in the 2029-30 count. That is a linear extrapolation, not a forecast. Across the full period from 2010-11 to 2024-25, multiracial enrollment had a 4.0% compound annual growth rate; Asian enrollment's compound annual rate from 2021-22 through 2024-25 was 1.9%.
Nationally, NCES data shows students of two or more races grew from 1.4 million to 2.5 million between 2012 and 2022, a 79% increase, and are projected to reach 6% of enrollment by 2031. Virginia, at 7.0%, is already there.
The growth in context
Among all racial and ethnic groups in Virginia from 2010-11 to 2024-25, only Hispanic enrollment grew faster.
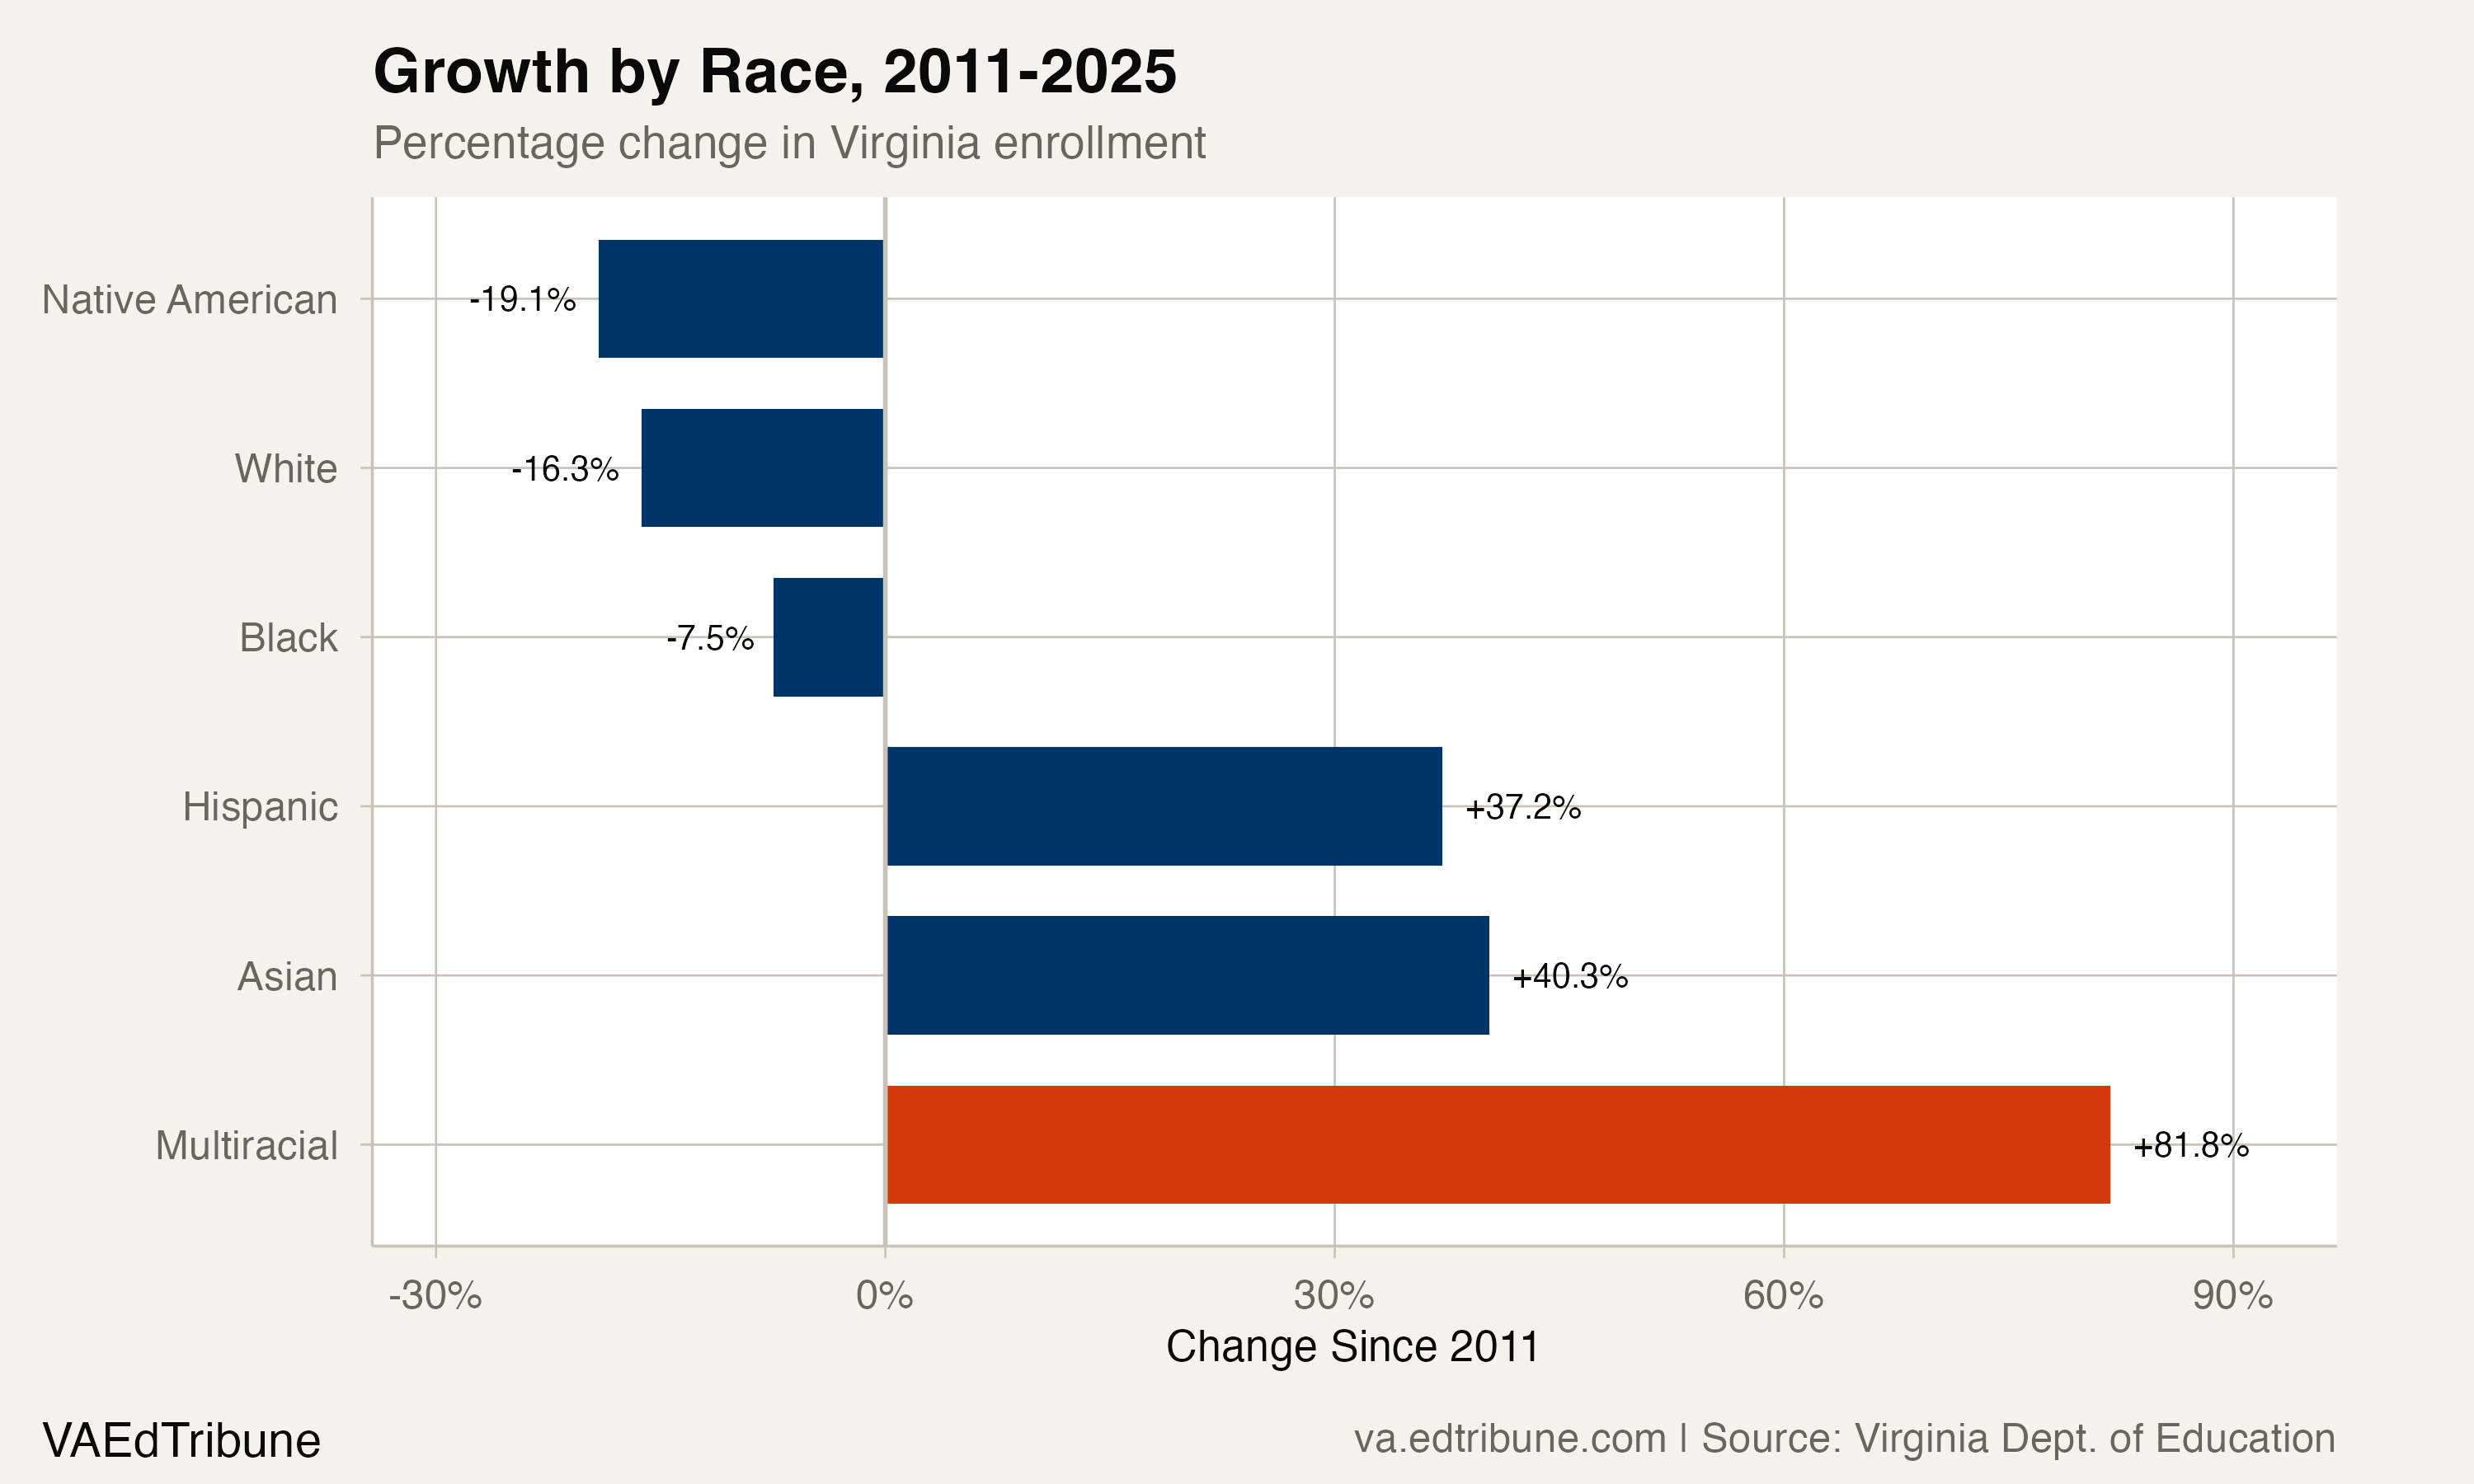
White enrollment fell 19.3%. Black enrollment fell 10.9%. Native American enrollment fell 22.3%. Asian enrollment grew 34.1%, multiracial 73.1% and Hispanic 77.9%. Hispanic students added about three times as many students as the multiracial group did, but from a larger starting point. In 63 of Virginia's 131 divisions, multiracial is now the second- or third-largest racial group. In rural southwestern Virginia, Bristol↗ET and Franklin County report multiracial as their largest non-white group.
The 88,643 multiracial students are reported in a separate category rather than in any single-race total. The aggregate file does not identify the race combinations within that category.
What the data hides
The enrollment numbers do not reveal which racial combinations make up Virginia's multiracial students. A student who is white and Asian, a student who is Black and Hispanic, and a student who is Native American and white all appear as the same "two or more races" data point. The 2020 Census found that the most common multiracial combination nationally is white and "some other race," heavily driven by Hispanic respondents who identify with both categories. Whether Virginia's school-level multiracial growth follows the same pattern is unknown from this data.
The next form change
The federal government finalized updated race and ethnicity standards in 2024. The standards combine race and ethnicity into a single question and add a Middle Eastern or North African category. If and when Virginia applies those standards to school enrollment, comparisons across the implementation boundary will require the same caution as the 2010-11 starting point.
The verified result is narrower: Virginia counted 37,429 more multiracial students in 2024-25 than in 2010-11, a 73.1% increase, and every division-level pattern in this article comes from the same aggregate category. The file supplies that category across the full window. It does not reveal how individual identities changed or predict what a future reporting standard will do to the series.
Detailed code that reproduces the analysis and figures in this article is available exclusively to EdTribune subscribers.
Correction (October 3, 2026): An earlier version of this article said multiracial enrollment was Virginia's fastest-growing racial group, more than doubling Hispanic growth. The state race counts it used for 2010-11 through 2015-16 had counted multiracial students as Hispanic as well and understated every other group. On the corrected data, Hispanic enrollment grew 77.9% from 2010-11 to 2024-25 and multiracial enrollment grew 73.1% (51,214 to 88,643), not 81.8%. The earlier version's 2016-17 spike in multiracial enrollment does not appear in the corrected series, and the paragraphs about it have been removed. Growth rates for other groups, the annual-gain range, and several division figures have also been corrected.
Discussion
Sign in to join the discussion.
Loading comments...