In the 2024-25 school year, Virginia enrolled 84,376 kindergartners and 97,429 seniors. The gap, 13,053 students, represents the annual rate at which Virginia's public school system is shrinking from the inside out.
This is not new. Virginia has had more 12th graders than kindergartners for eight consecutive school years, since the lines first crossed in 2017-18. But the gap is widening. In 2017-18, the K-to-G12 ratio was 97.7, close enough to call a tie. By 2024-25, the most recent school year in the state's published data, it had fallen to 86.6. For every 100 seniors leaving the system, only 87 kindergartners are walking in.
Where the pipeline broke
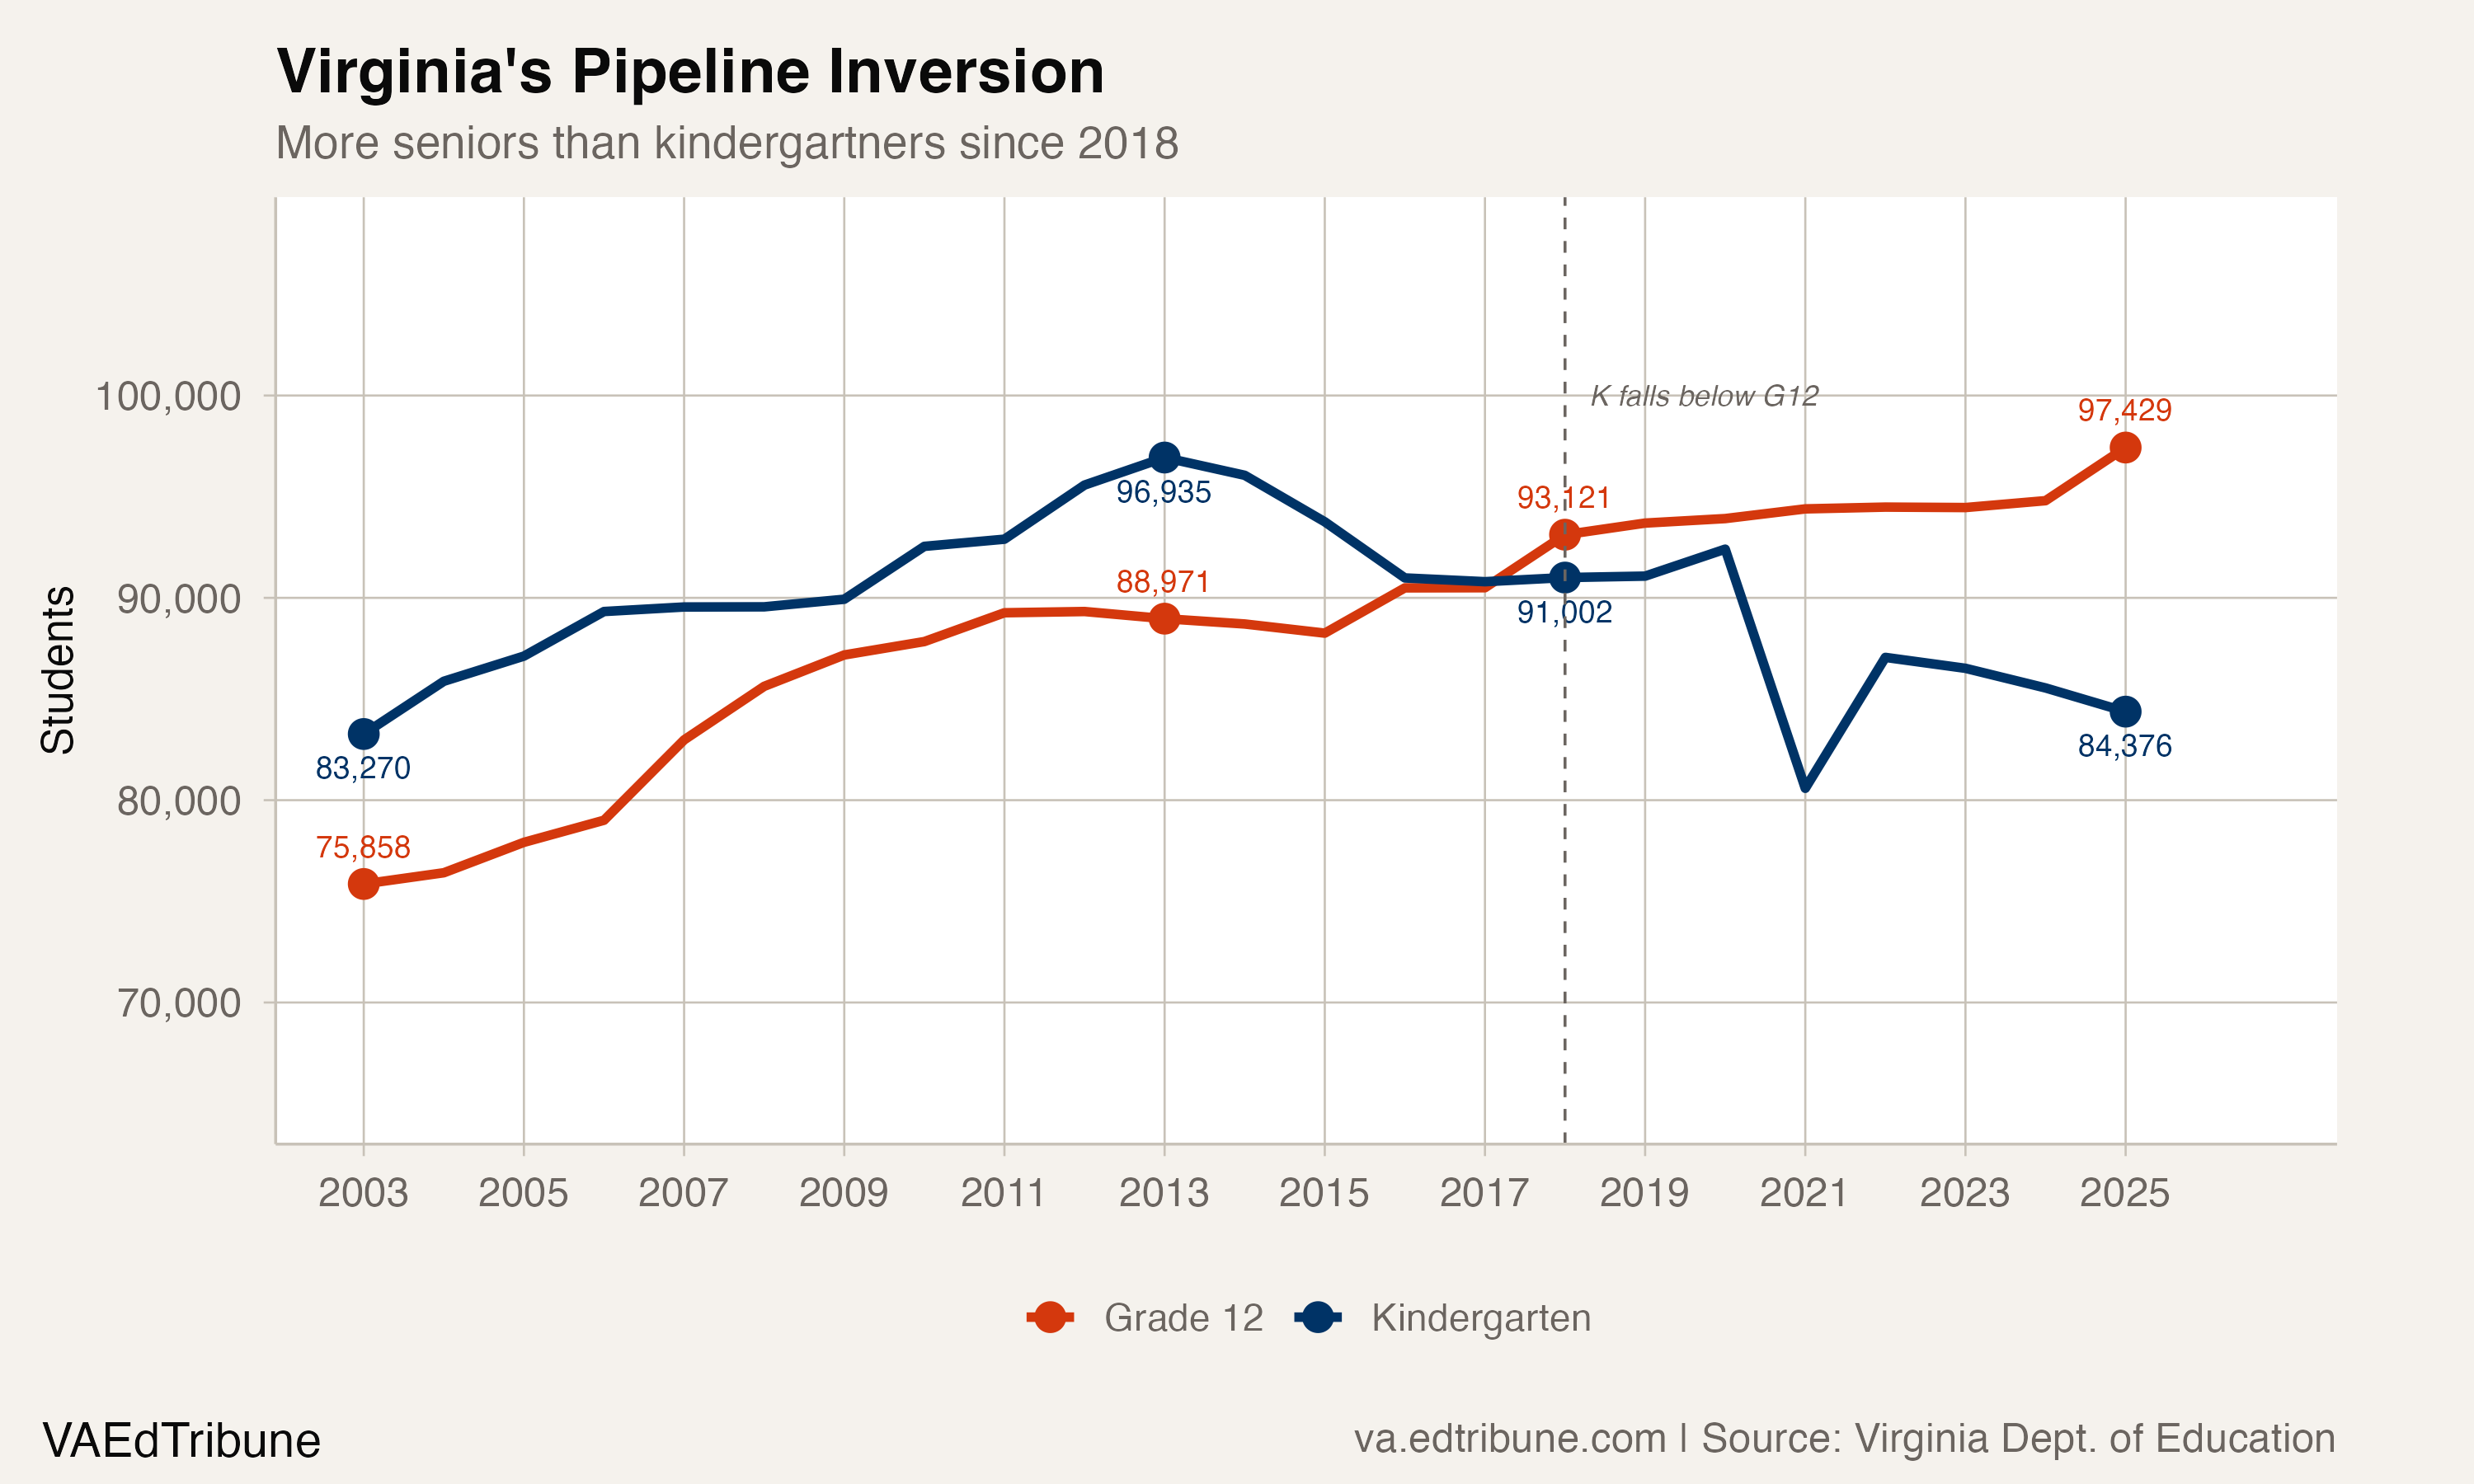
Kindergarten enrollment peaked at 96,935 in 2012-13, when Virginia's birth rate was still producing cohorts large enough to fill classrooms. Since then, K enrollment has fallen 13.0%, losing 12,559 students. Twelfth-grade enrollment, meanwhile, grew 28.4% over the full 22-year data window, from 75,858 in 2002-03 to 97,429 in 2024-25. The two trends were on a collision course for years before they crossed.
The timing is not coincidental. Virginia births peaked at 108,416 in 2007 and have fallen in 11 of the past 17 years. Children born during that peak reached kindergarten age around 2012 and 2013, which lines up with the 2012-13 kindergarten peak. The 2024 birth count trails the 2007 peak by 14,422, a 13.3% decline. The Cooper Center ties those smaller birth cohorts to smaller kindergarten classes about five years later. Births are not the whole story, though: migration, private schooling and homeschooling also decide whether a child shows up in Virginia's public-school count.
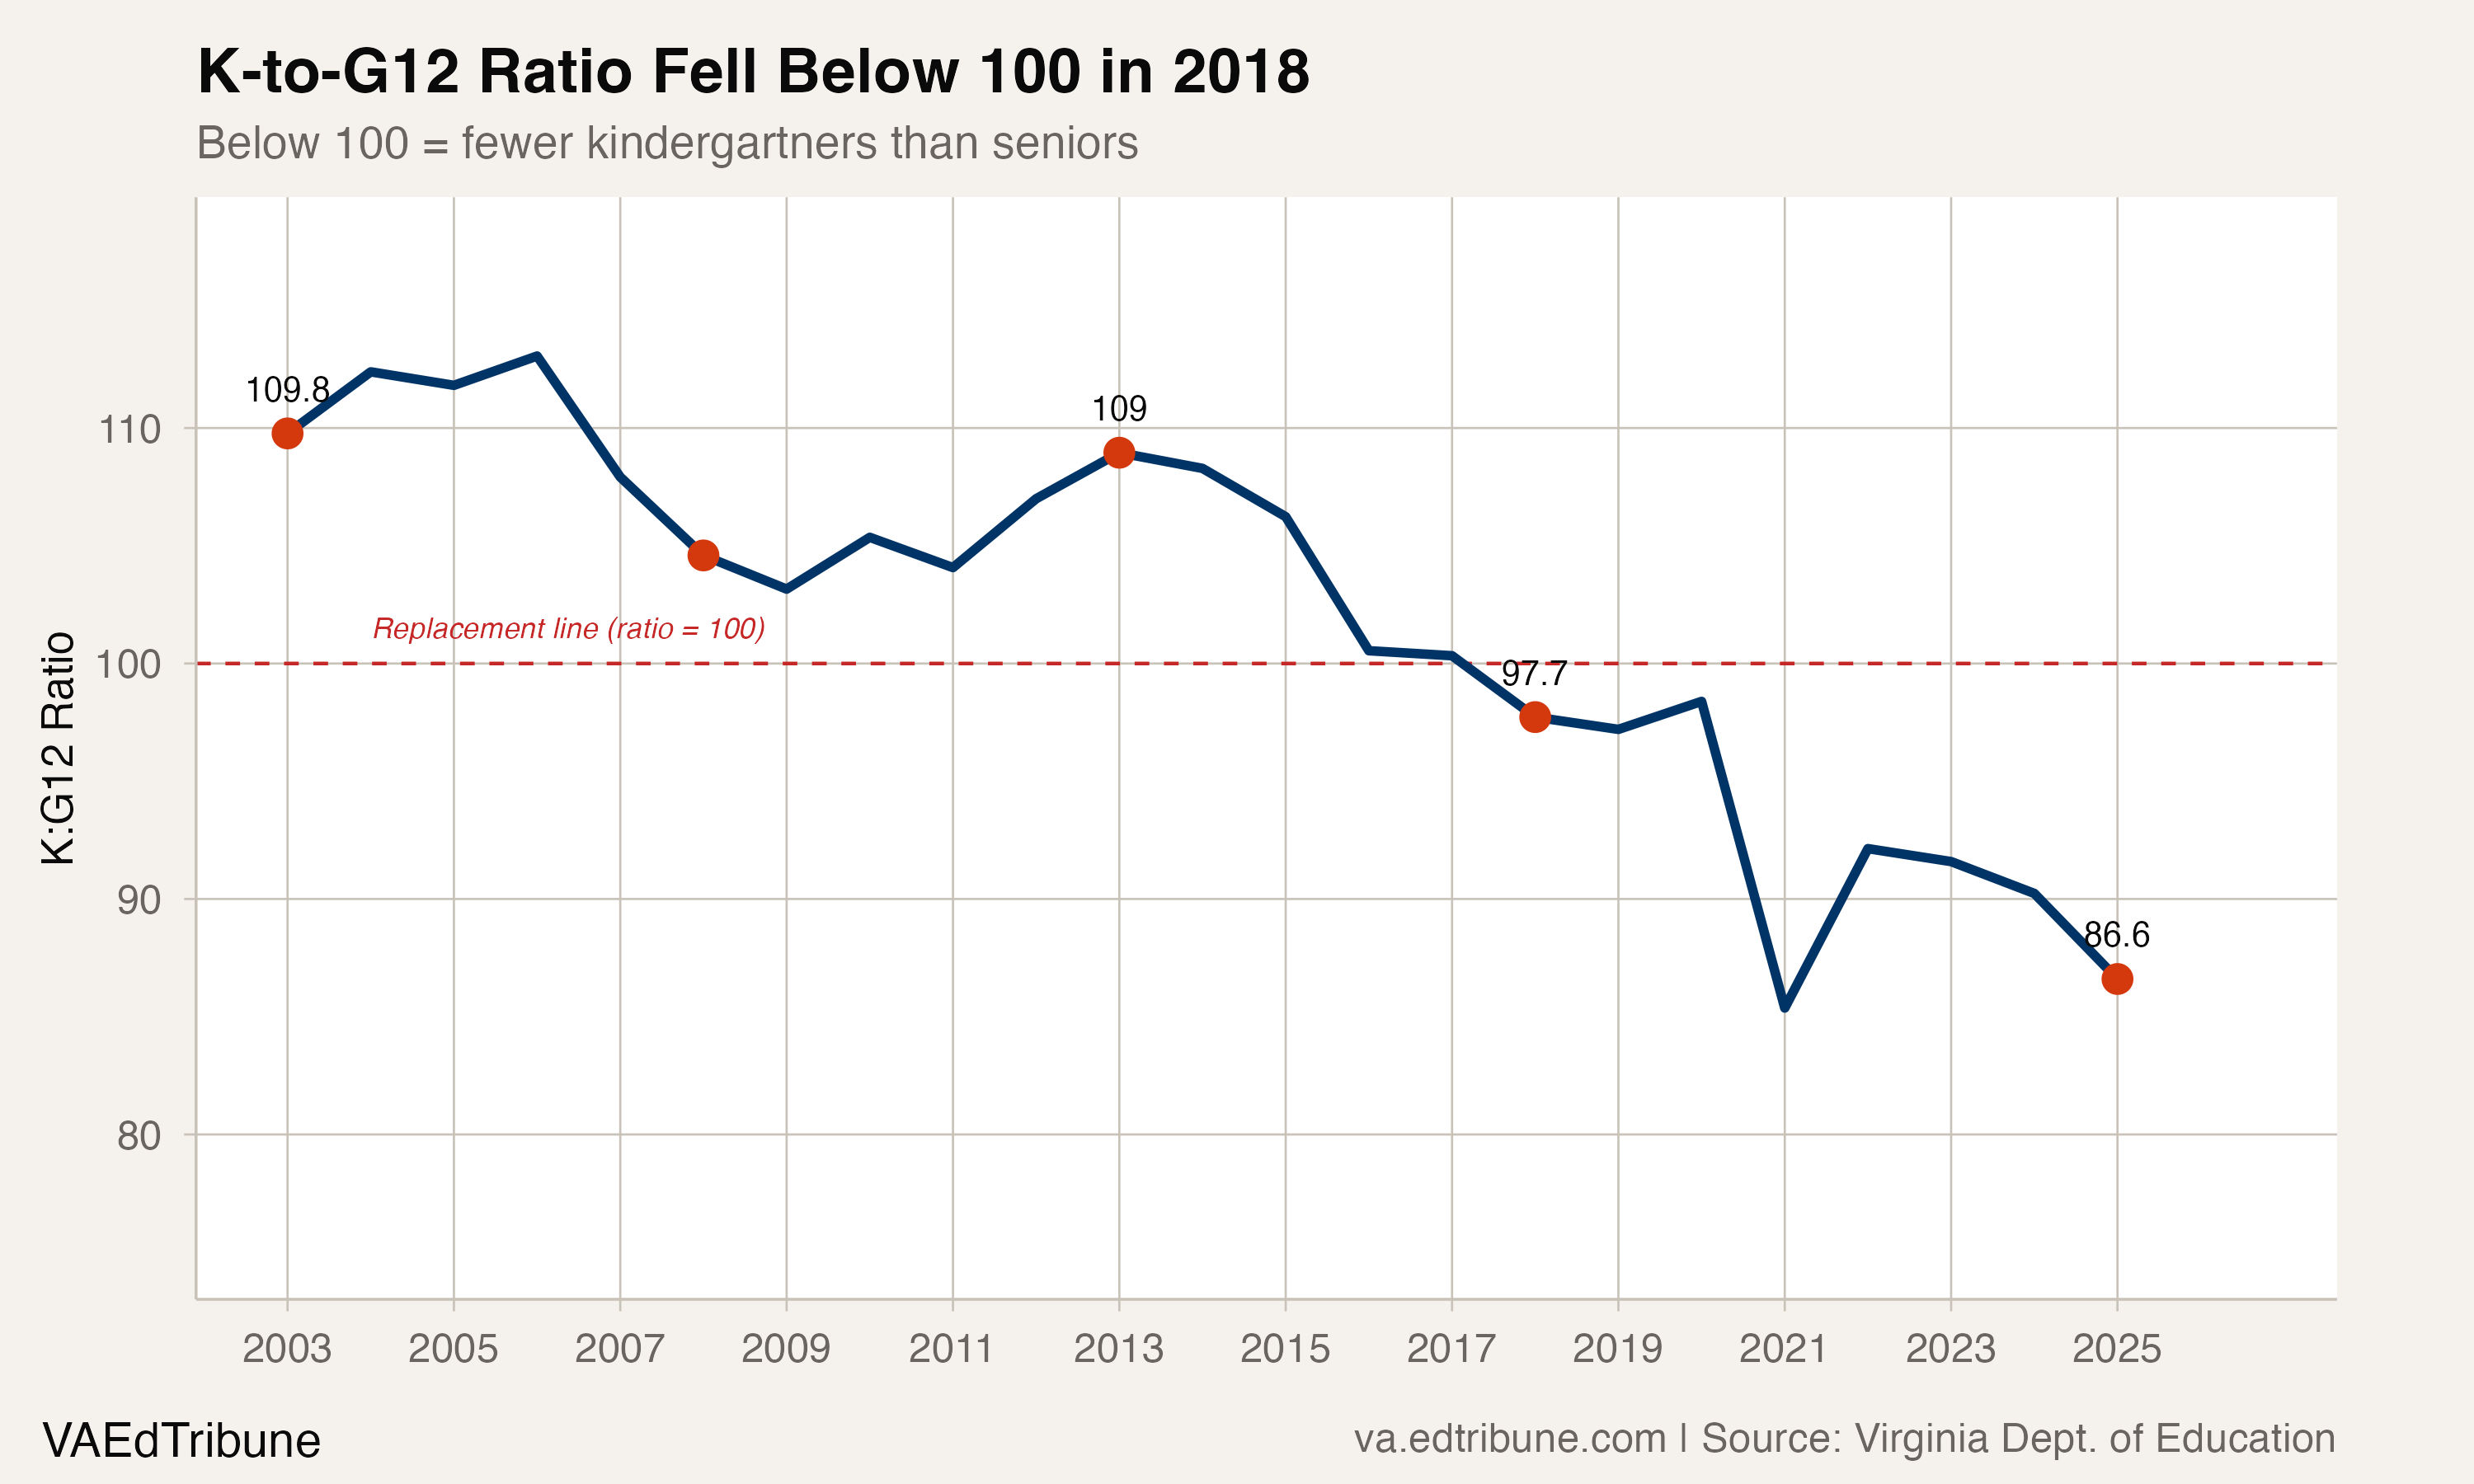
The ratio chart makes the trajectory stark. Virginia spent the 2000s comfortably above the replacement line, with roughly 109 kindergartners for every 100 seniors. After the 2012-13 kindergarten peak, the ratio slid, dropped below 100 in 2017-18, and has not recovered. The pandemic year of 2020-21 drove it to a low of 85.4, when kindergarten enrollment fell by 11,821 in a single year. The rebound that followed briefly improved the ratio, but by 2024-25 it had fallen back to 86.6, barely above the pandemic low.
The wave moving through the system
The pipeline collapse did not happen all at once. It moved grade by grade, and the data traces its path.
Elementary enrollment (K through 5th grade) peaked at 580,088 in 2014-15 and has since lost 35,973 students, a 6.2% decline. Middle school (grades 6-8) peaked later, in 2019-20, at 299,397 and is now down 17,508 (5.8%). High school (grades 9-12) peaked latest of all, in 2023-24, at 401,324. The 2024-25 figure of 398,870 is the first decline after that high-school peak.
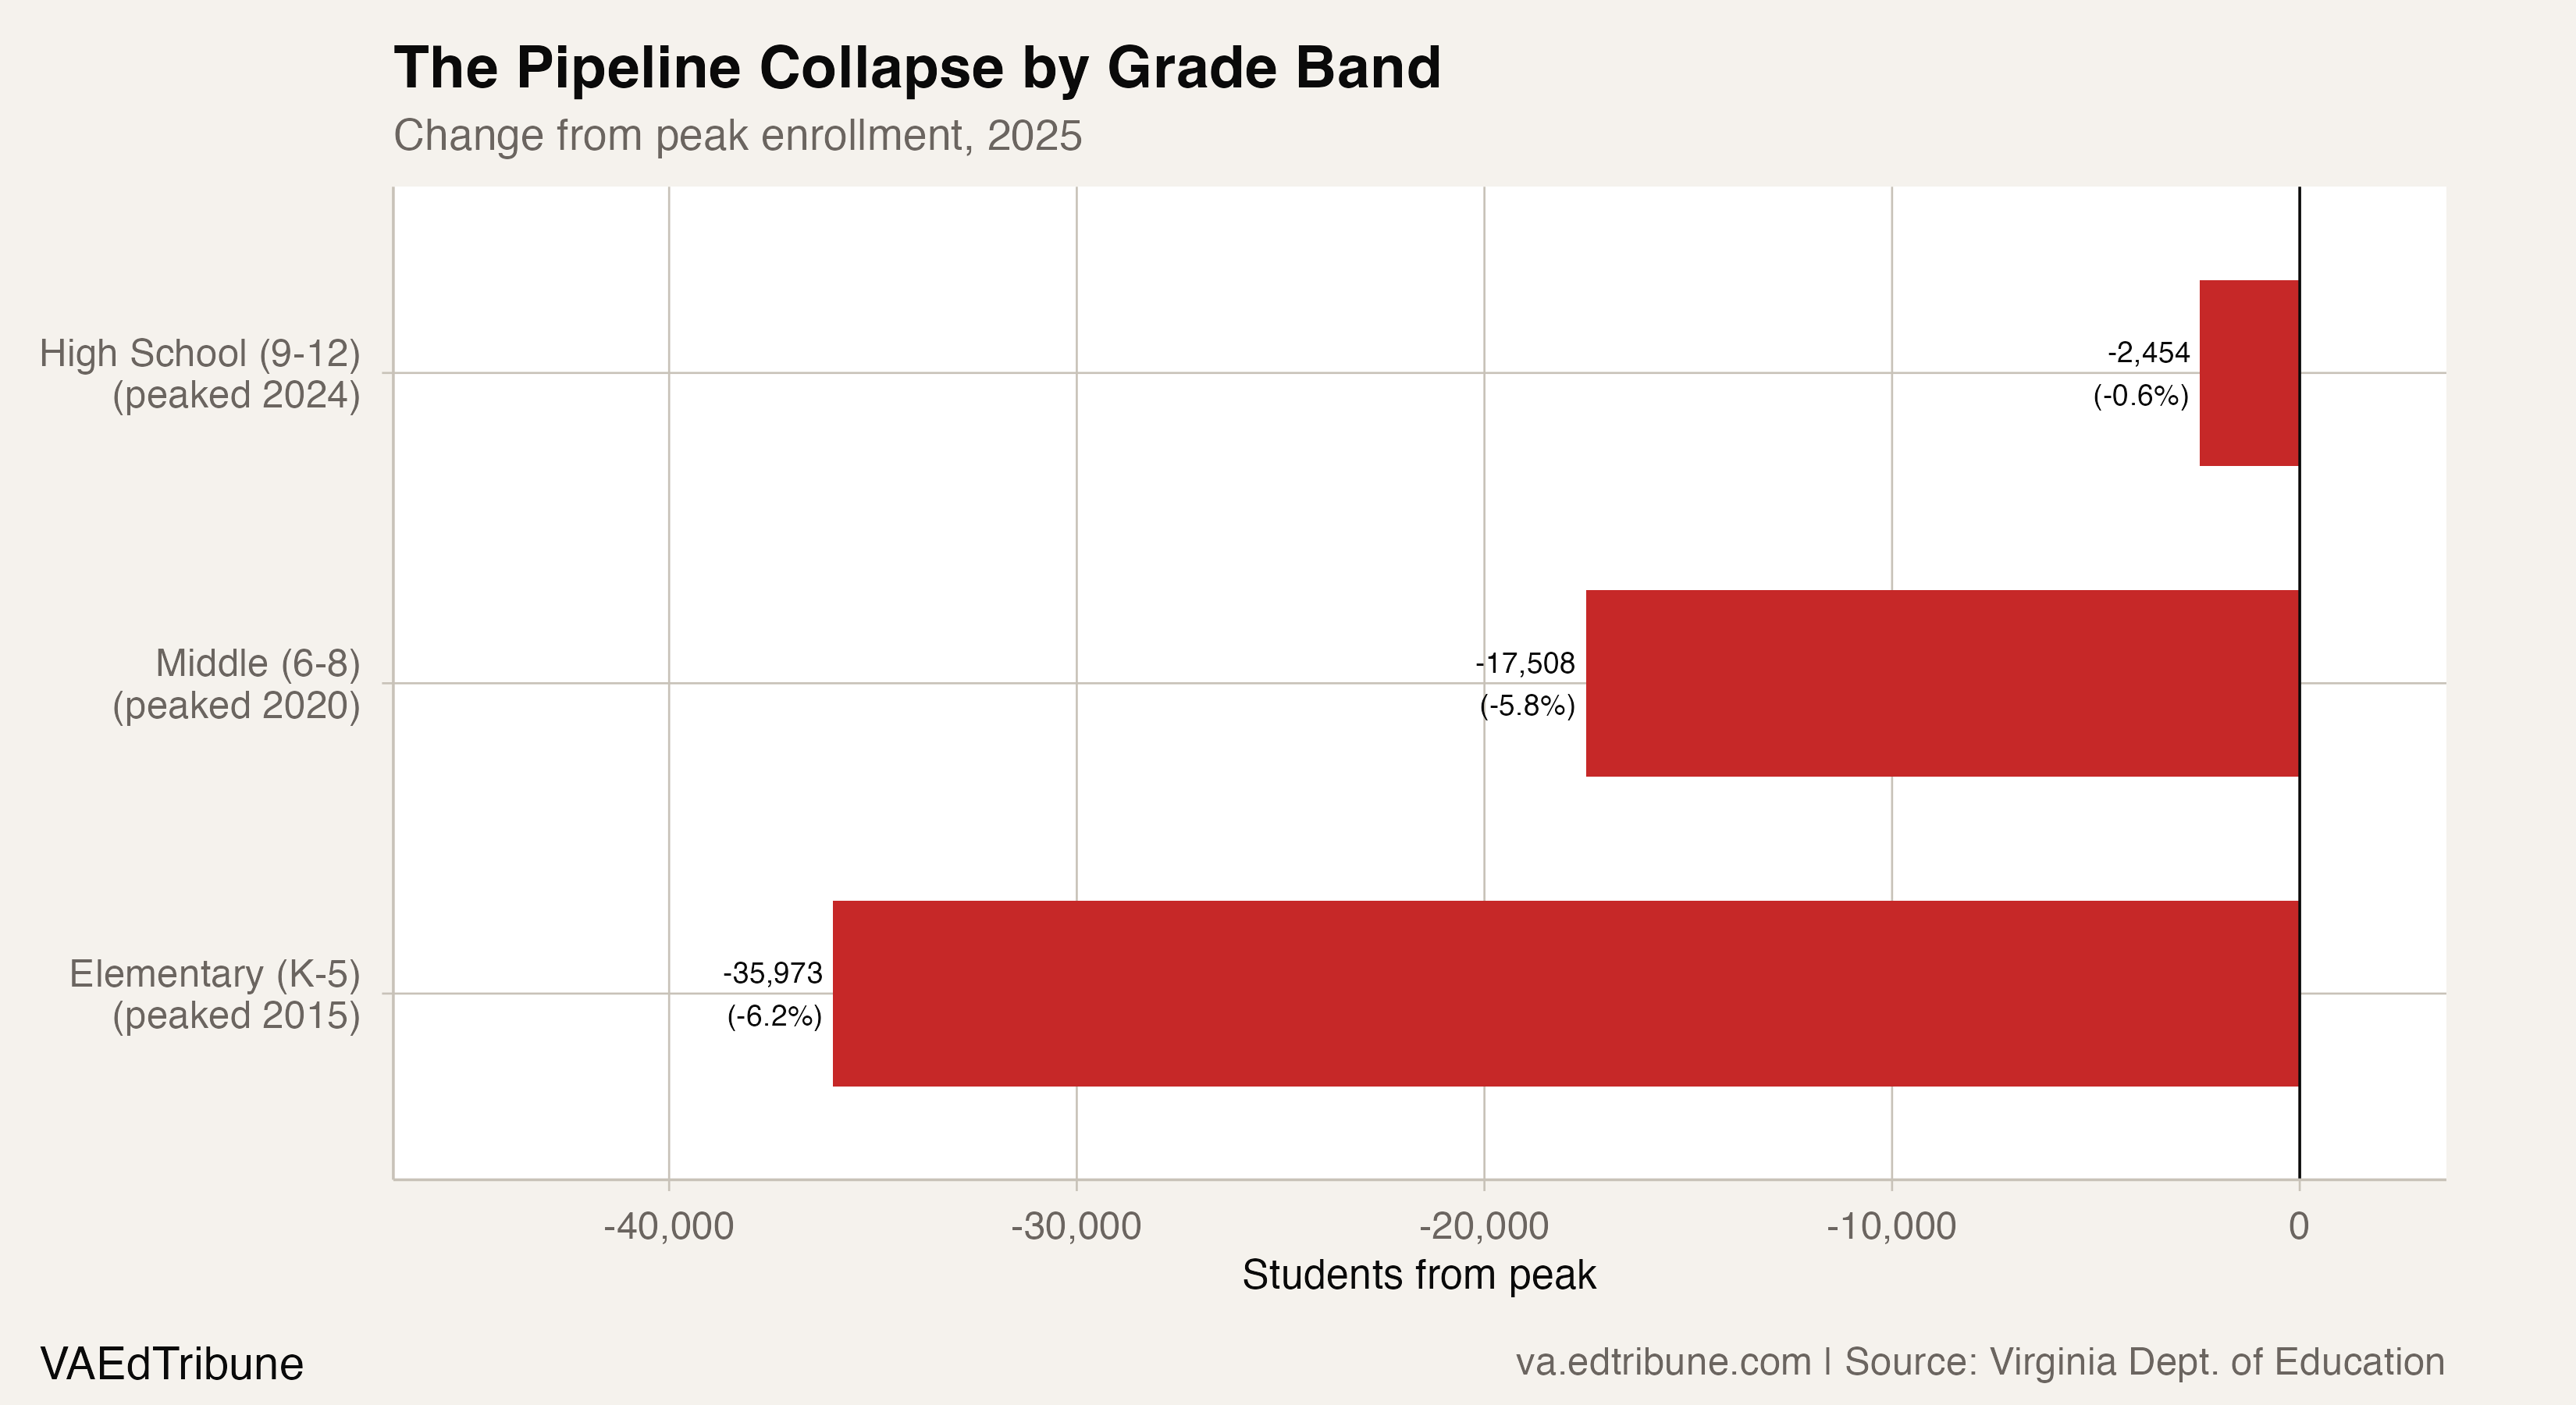
The sequencing tells the story. Smaller kindergarten classes from 2013-14 onward reached elementary schools first. Those shrunken cohorts moved into middle school by the late 2010s. Now they are arriving at high school. The Weldon Cooper Center for Public Service at UVA reported that grades 9-12 accounted for 7,326 students, about half of the 14,939 students lost statewide in fall 2025, as Virginia's largest graduating class was replaced by a much smaller ninth-grade class.
The one counter-trend is Pre-K, which grew from 14,507 students in 2002-03 to 36,708 in 2024-25, a 153% increase. Virginia has expanded public preschool access substantially over two decades. That growth does not add to the K-12 pipeline one for one, because most of those children would have entered kindergarten the following year either way.
The 9th grade anomaly
One feature of Virginia's pipeline defies the shrinking-cohort narrative: 9th grade is consistently larger than 8th grade.
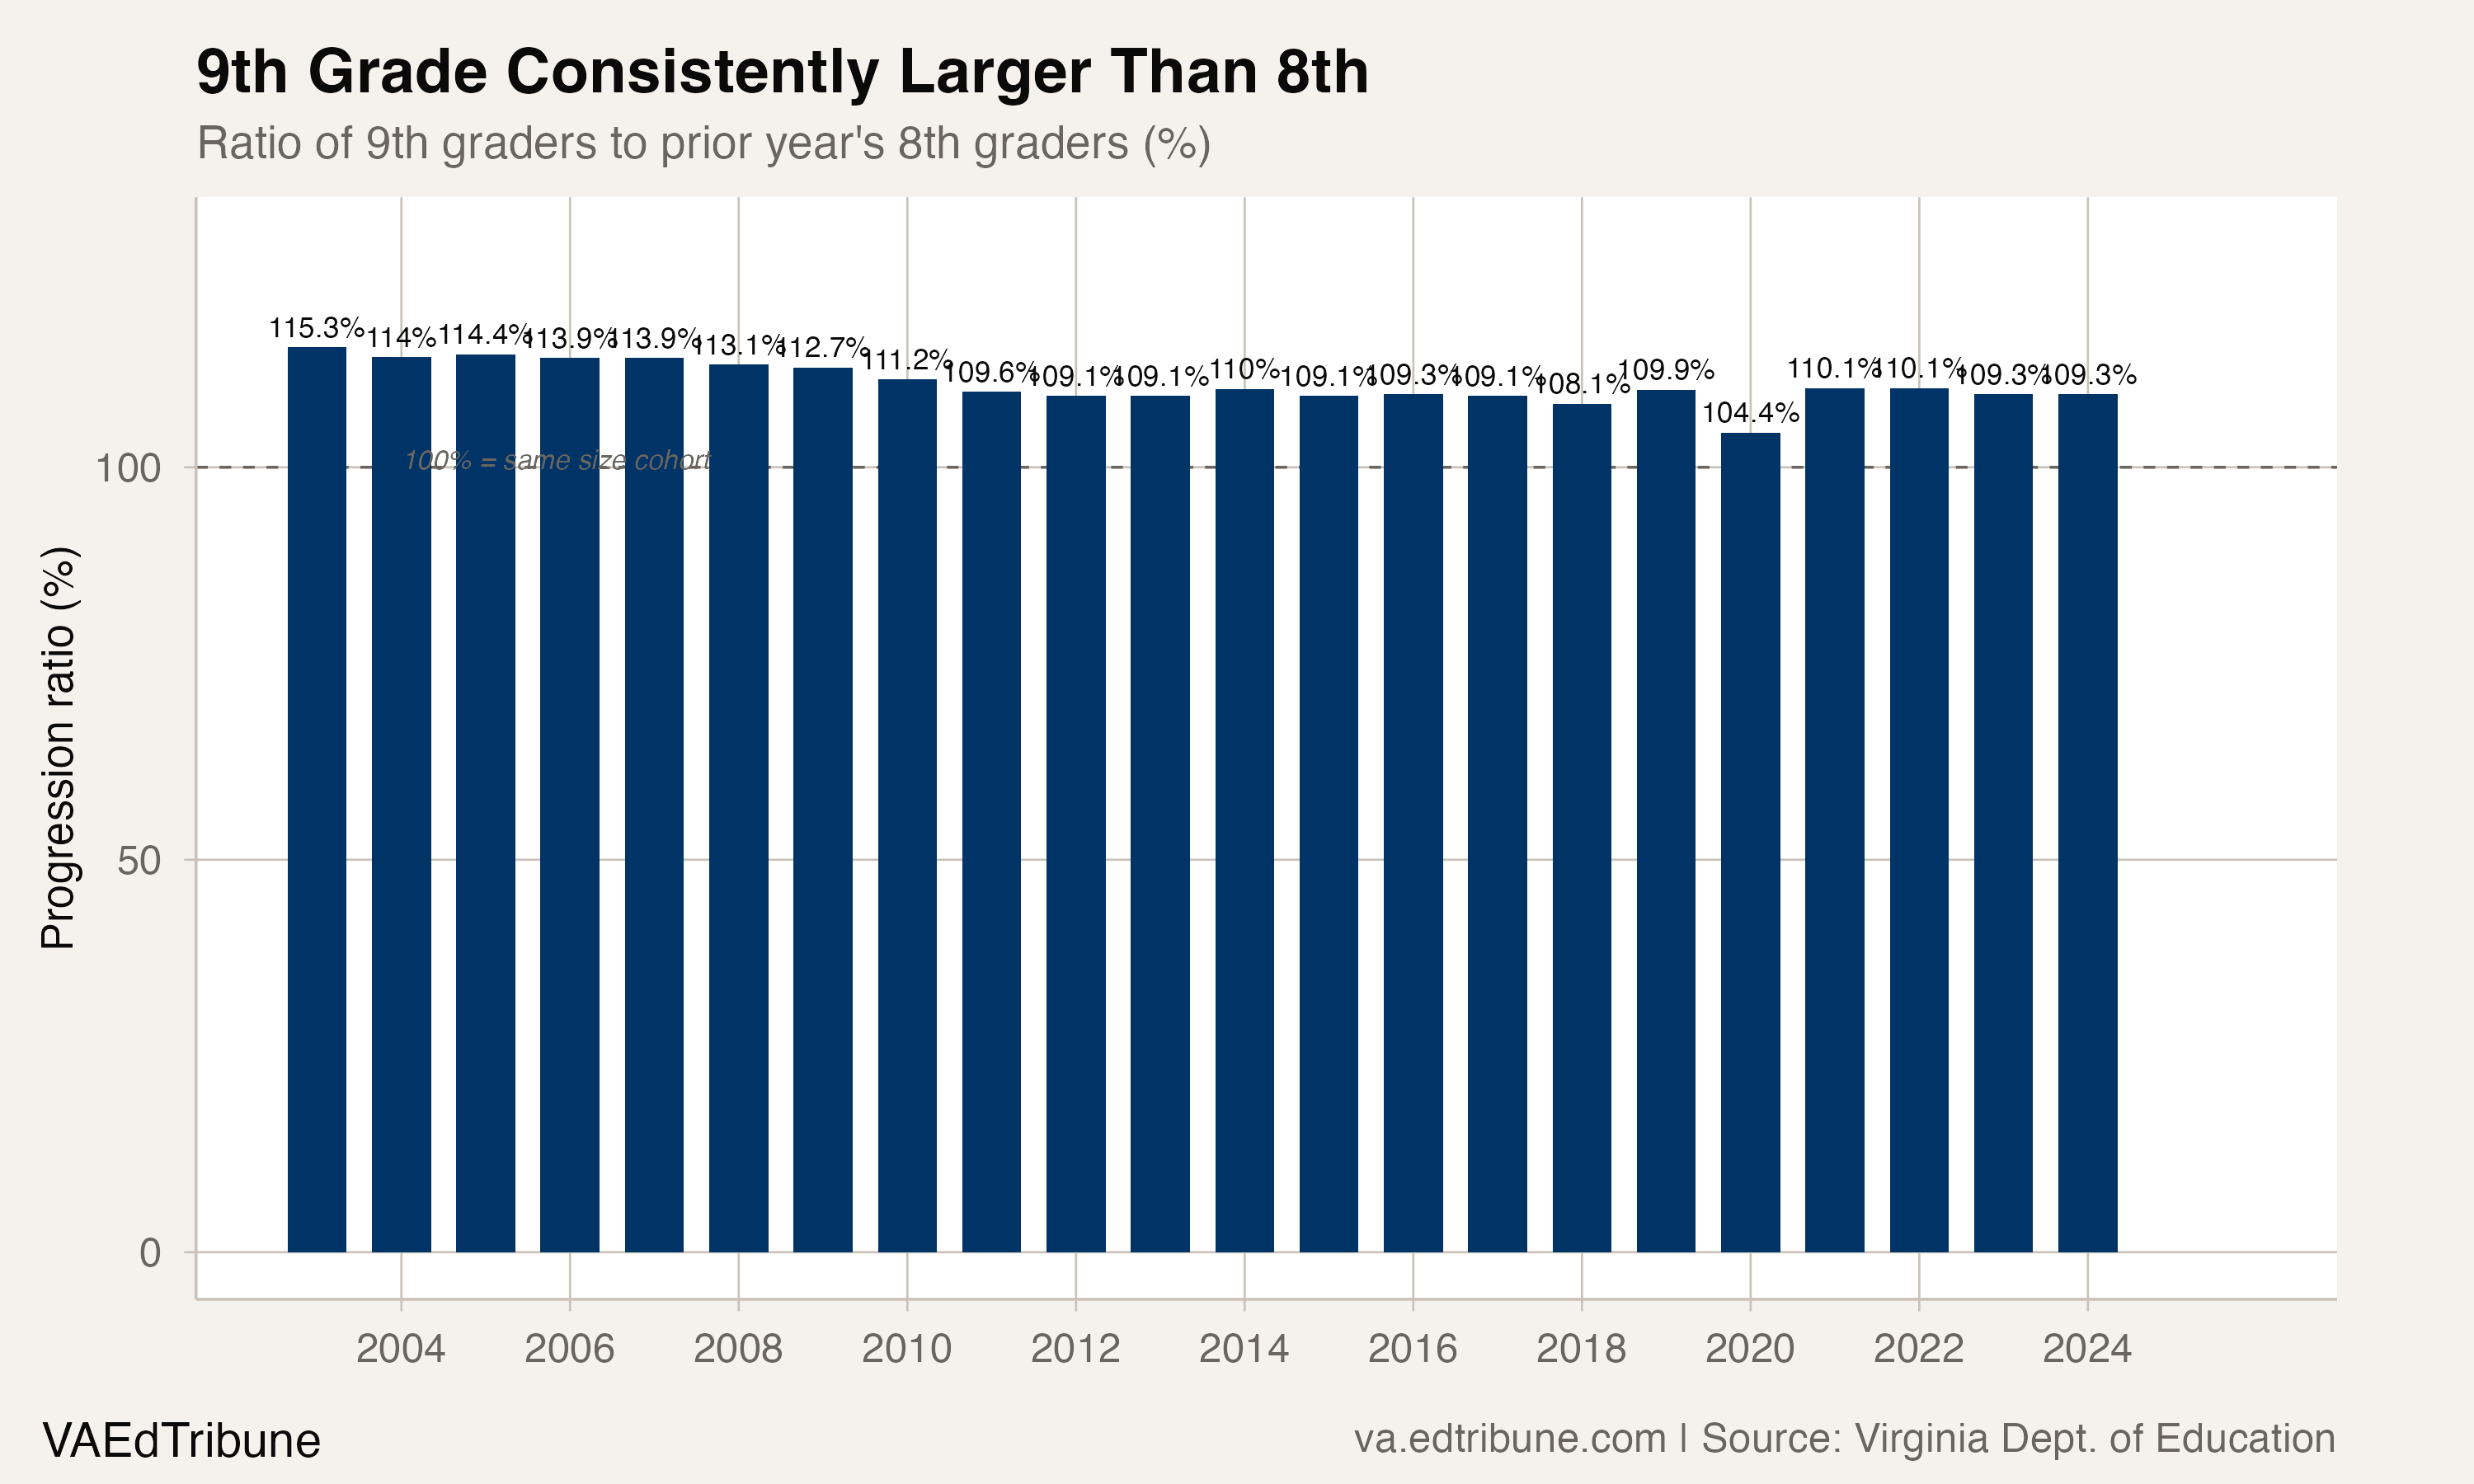
In every one of the 22 year-to-year transitions in the data, the 9th grade class exceeds the prior year's 8th grade class, by 4% to 15%, with an average progression ratio of 110.7%. That means roughly 10,000 students appear in Virginia's public high schools each fall who were not in Virginia's public 8th grade the year before.
Students returning from private school or homeschooling, or moving in from out of state, are plausible sources, but the state's enrollment files do not record where those students came from. Virginia's homeschool population reached 66,117 in 2025-26, a 49.5% increase since the pandemic. Some of those families may return their children to public school for high school, but no published figure shows how many do. The 9th grade bulge has been shrinking over time (from 115.3% for the 8th graders of 2002-03 to 109.3% for the 8th graders of 2023-24), which could reflect either fewer private/homeschool students returning or a genuine shrinking of the non-public feeder pool.
Kindergarten losses are accelerating, not stabilizing
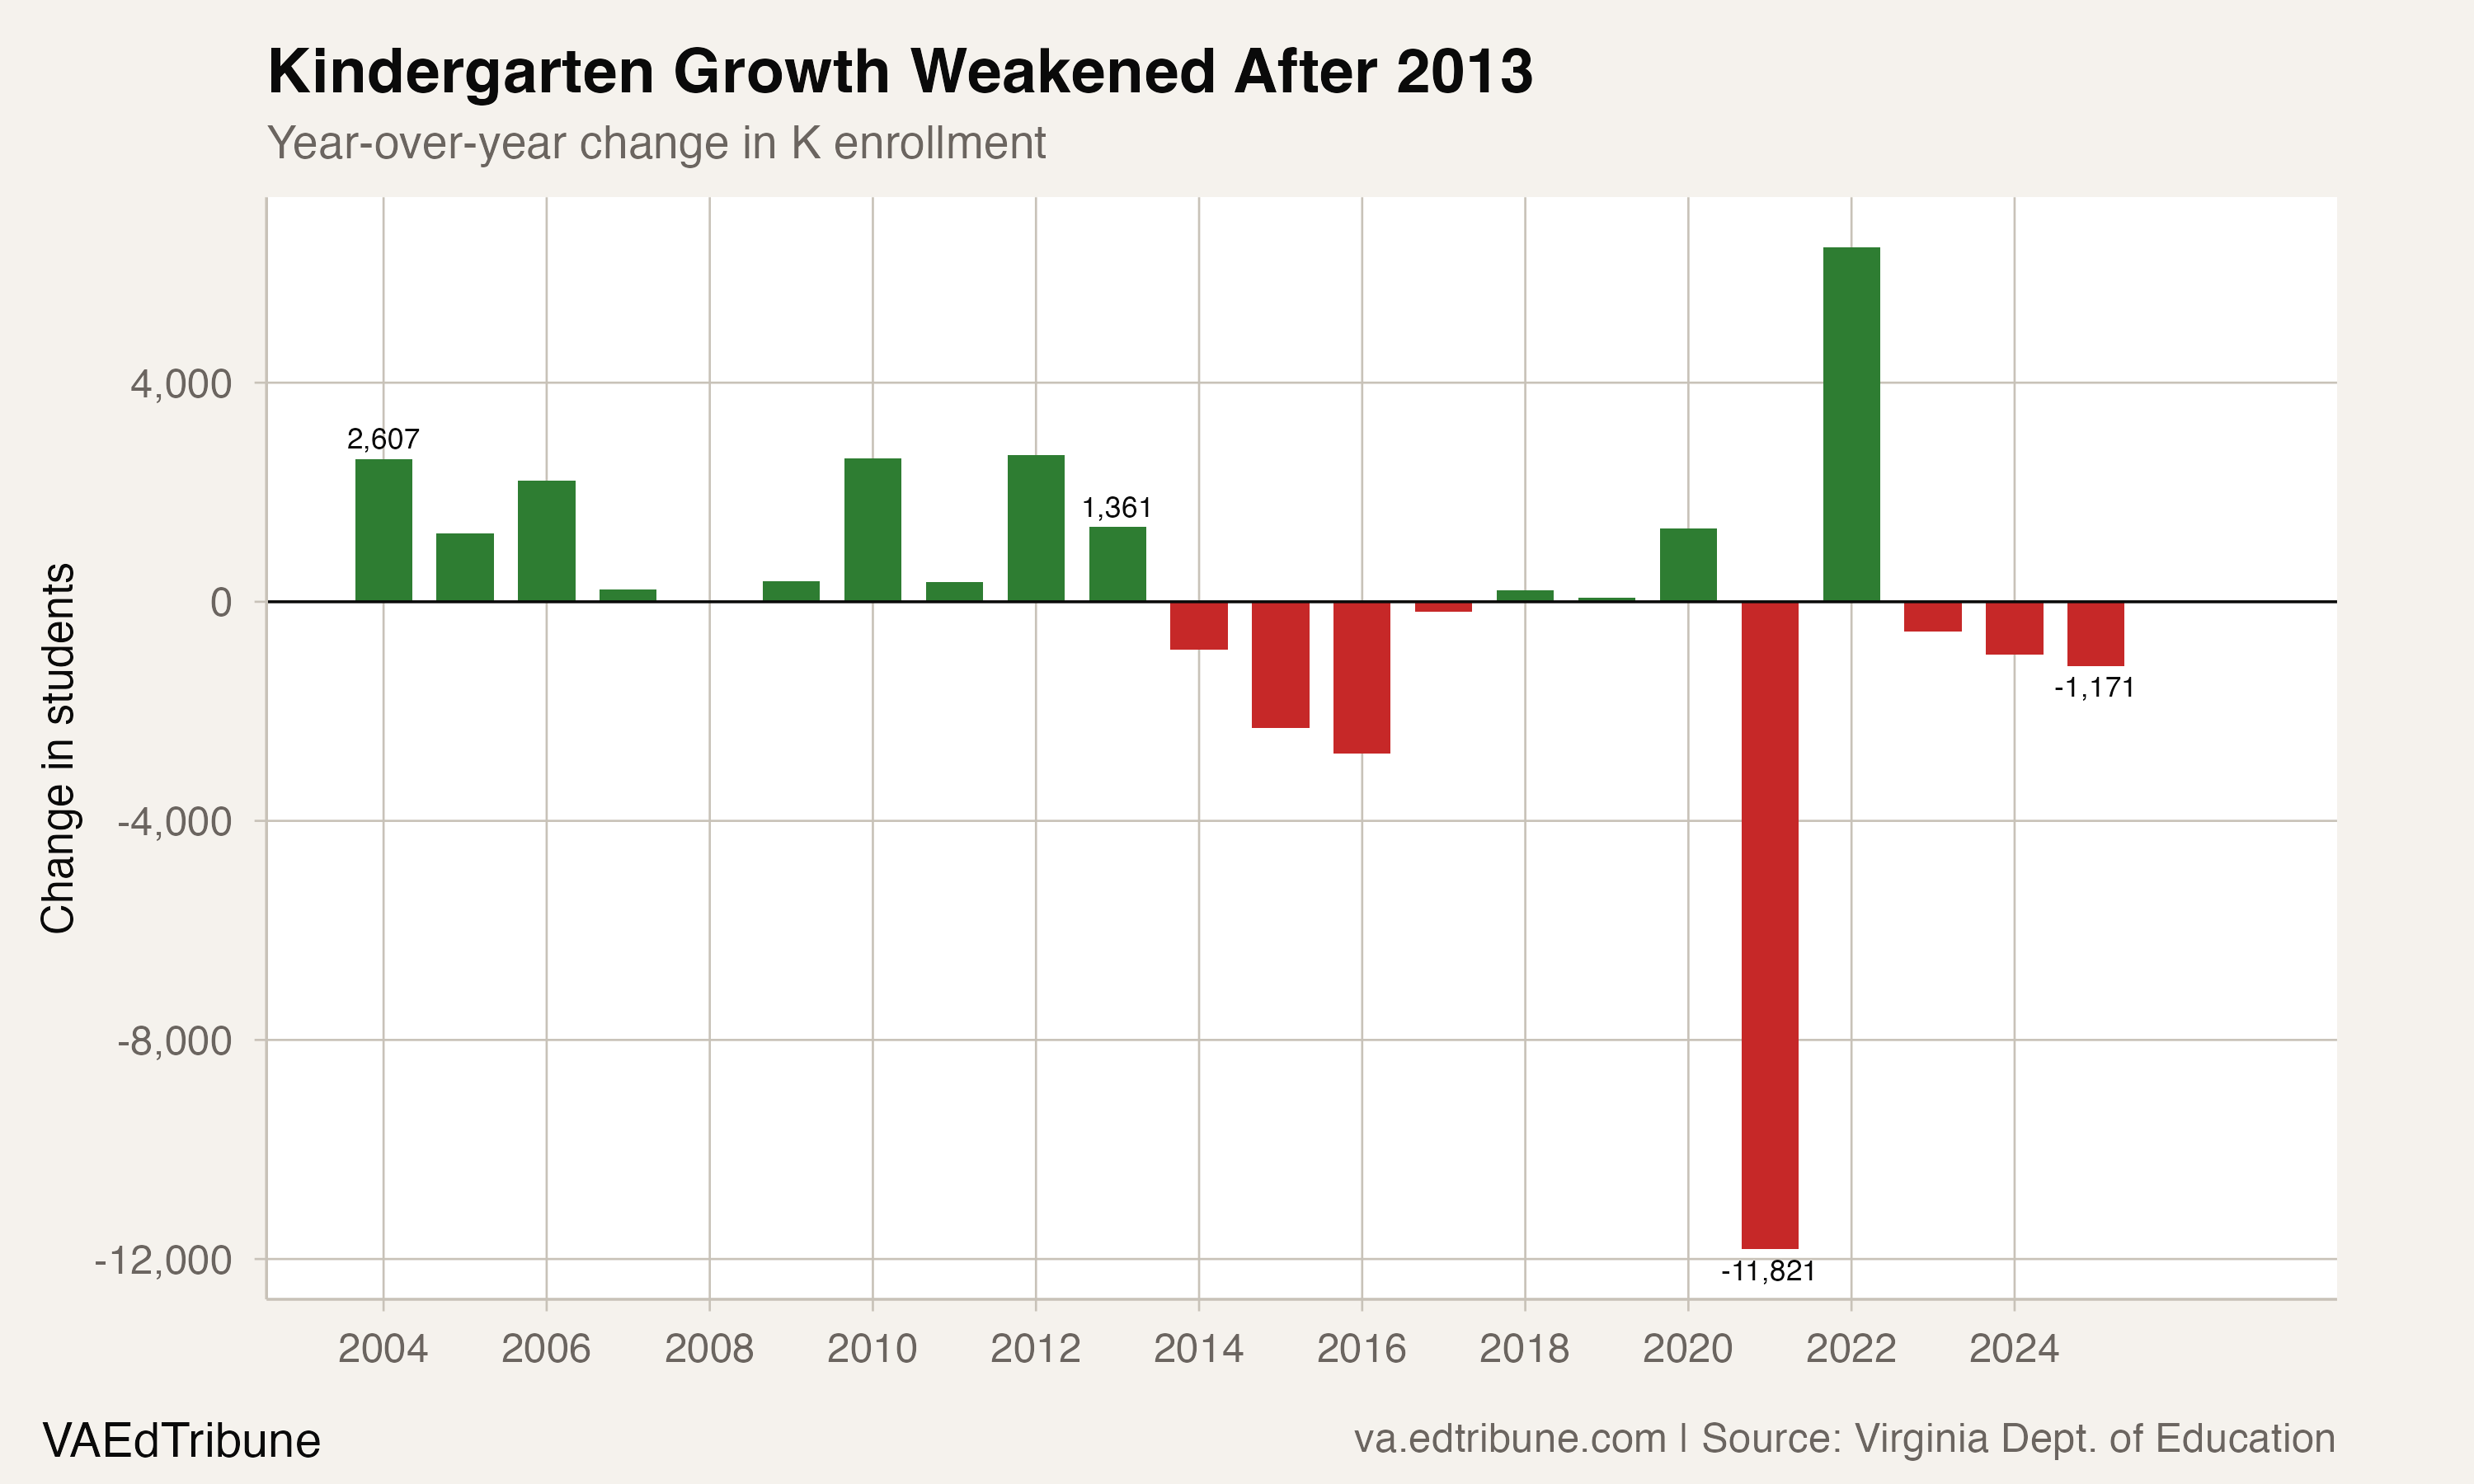
The year-over-year change in kindergarten enrollment tells a more granular story than the trendline. Virginia added kindergartners every year from 2003-04 through 2012-13, a decade of unbroken growth averaging roughly 1,370 per year. Then the direction reversed. Between 2013-14 and 2019-20, before the pandemic drop of 2020-21, K enrollment fell by a net 3,651 students despite small rebounds in 2017-18, 2018-19 and 2019-20.
Since the pandemic, the pattern has worsened. After a one-year rebound in 2021-22, K enrollment declined in three straight years: down 540 in 2022-23, 970 in 2023-24, and 1,171 in 2024-25. The Cooper Center reported that kindergarten class sizes have decreased every year since the 2022 rebound and at a faster rate than when the trend first emerged in 2014.
What this means for schools
The fiscal consequences arrive with a lag, just like the enrollment decline itself. Virginia's Standards of Quality funding process ties many state funding calculations to pupil counts, so sustained enrollment losses eventually show up in staffing and budget planning; the exact fiscal effect varies by division and funding stream. Zach Jackson, the Cooper Center's school enrollment projections manager, noted that "this gap suggests that factors beyond the long-term decline in births contributed to the recent drop; however, we're unable to confidently identify these drivers at this time."
Non-birth factors are visible around the edges of the public-school count, even if they are hard to quantify precisely. Virginia's homeschool population has grown 49.5% since the pandemic, reaching 66,117 students in 2025-26. Virginia Lab Schools are public schools but not school divisions, which means they sit outside the standard division-level pipeline story. This article does not quantify how much either pathway changes public-school enrollment.
The Cooper Center's fall 2025 enrollment update put the scale of the revision in stark terms: the state lost 14,939 students that year, the second-largest single-year drop in three decades, outpacing the 10,029-student decline that had been expected.
Elementary schools have been absorbing this shock for a decade. Middle schools are absorbing it now. High schools, which peaked in 2023-24, are next. The 84,376 kindergartners who entered Virginia's schools in fall 2024 will reach 9th grade in 2033. Unless the 9th grade bulge from private and homeschool returnees grows substantially, that freshman class will be much smaller than the high-school cohorts Virginia has recently enrolled. The pipeline is not about to break. It broke eight years ago. The rest of the system is just now catching up.
Detailed code that reproduces the analysis and figures in this article is available exclusively to EdTribune subscribers.
Discussion
Sign in to join the discussion.
Loading comments...