Virginia's public schools enrolled 185,155 students with Individualized Education Programs in 2024-25, a 6.3% increase from 174,223 just two years earlier. Total enrollment fell by 1,947 students over the same period. The result: one in 6.8 Virginia students now receives special education services, up from one in 7.3 in 2022-23, and the share is still climbing.
The growth adds 10,932 students to a system already struggling to staff special education classrooms. Virginia reported 784 unfilled special education teaching positions in the most recent count, up from 654 two years prior. That vacancy rate, 6.1% of the special education workforce, is higher than in any other teaching area statewide.
Growing demand, shrinking base
The divergence between total enrollment and special education enrollment is reshaping budgets across Virginia divisions.
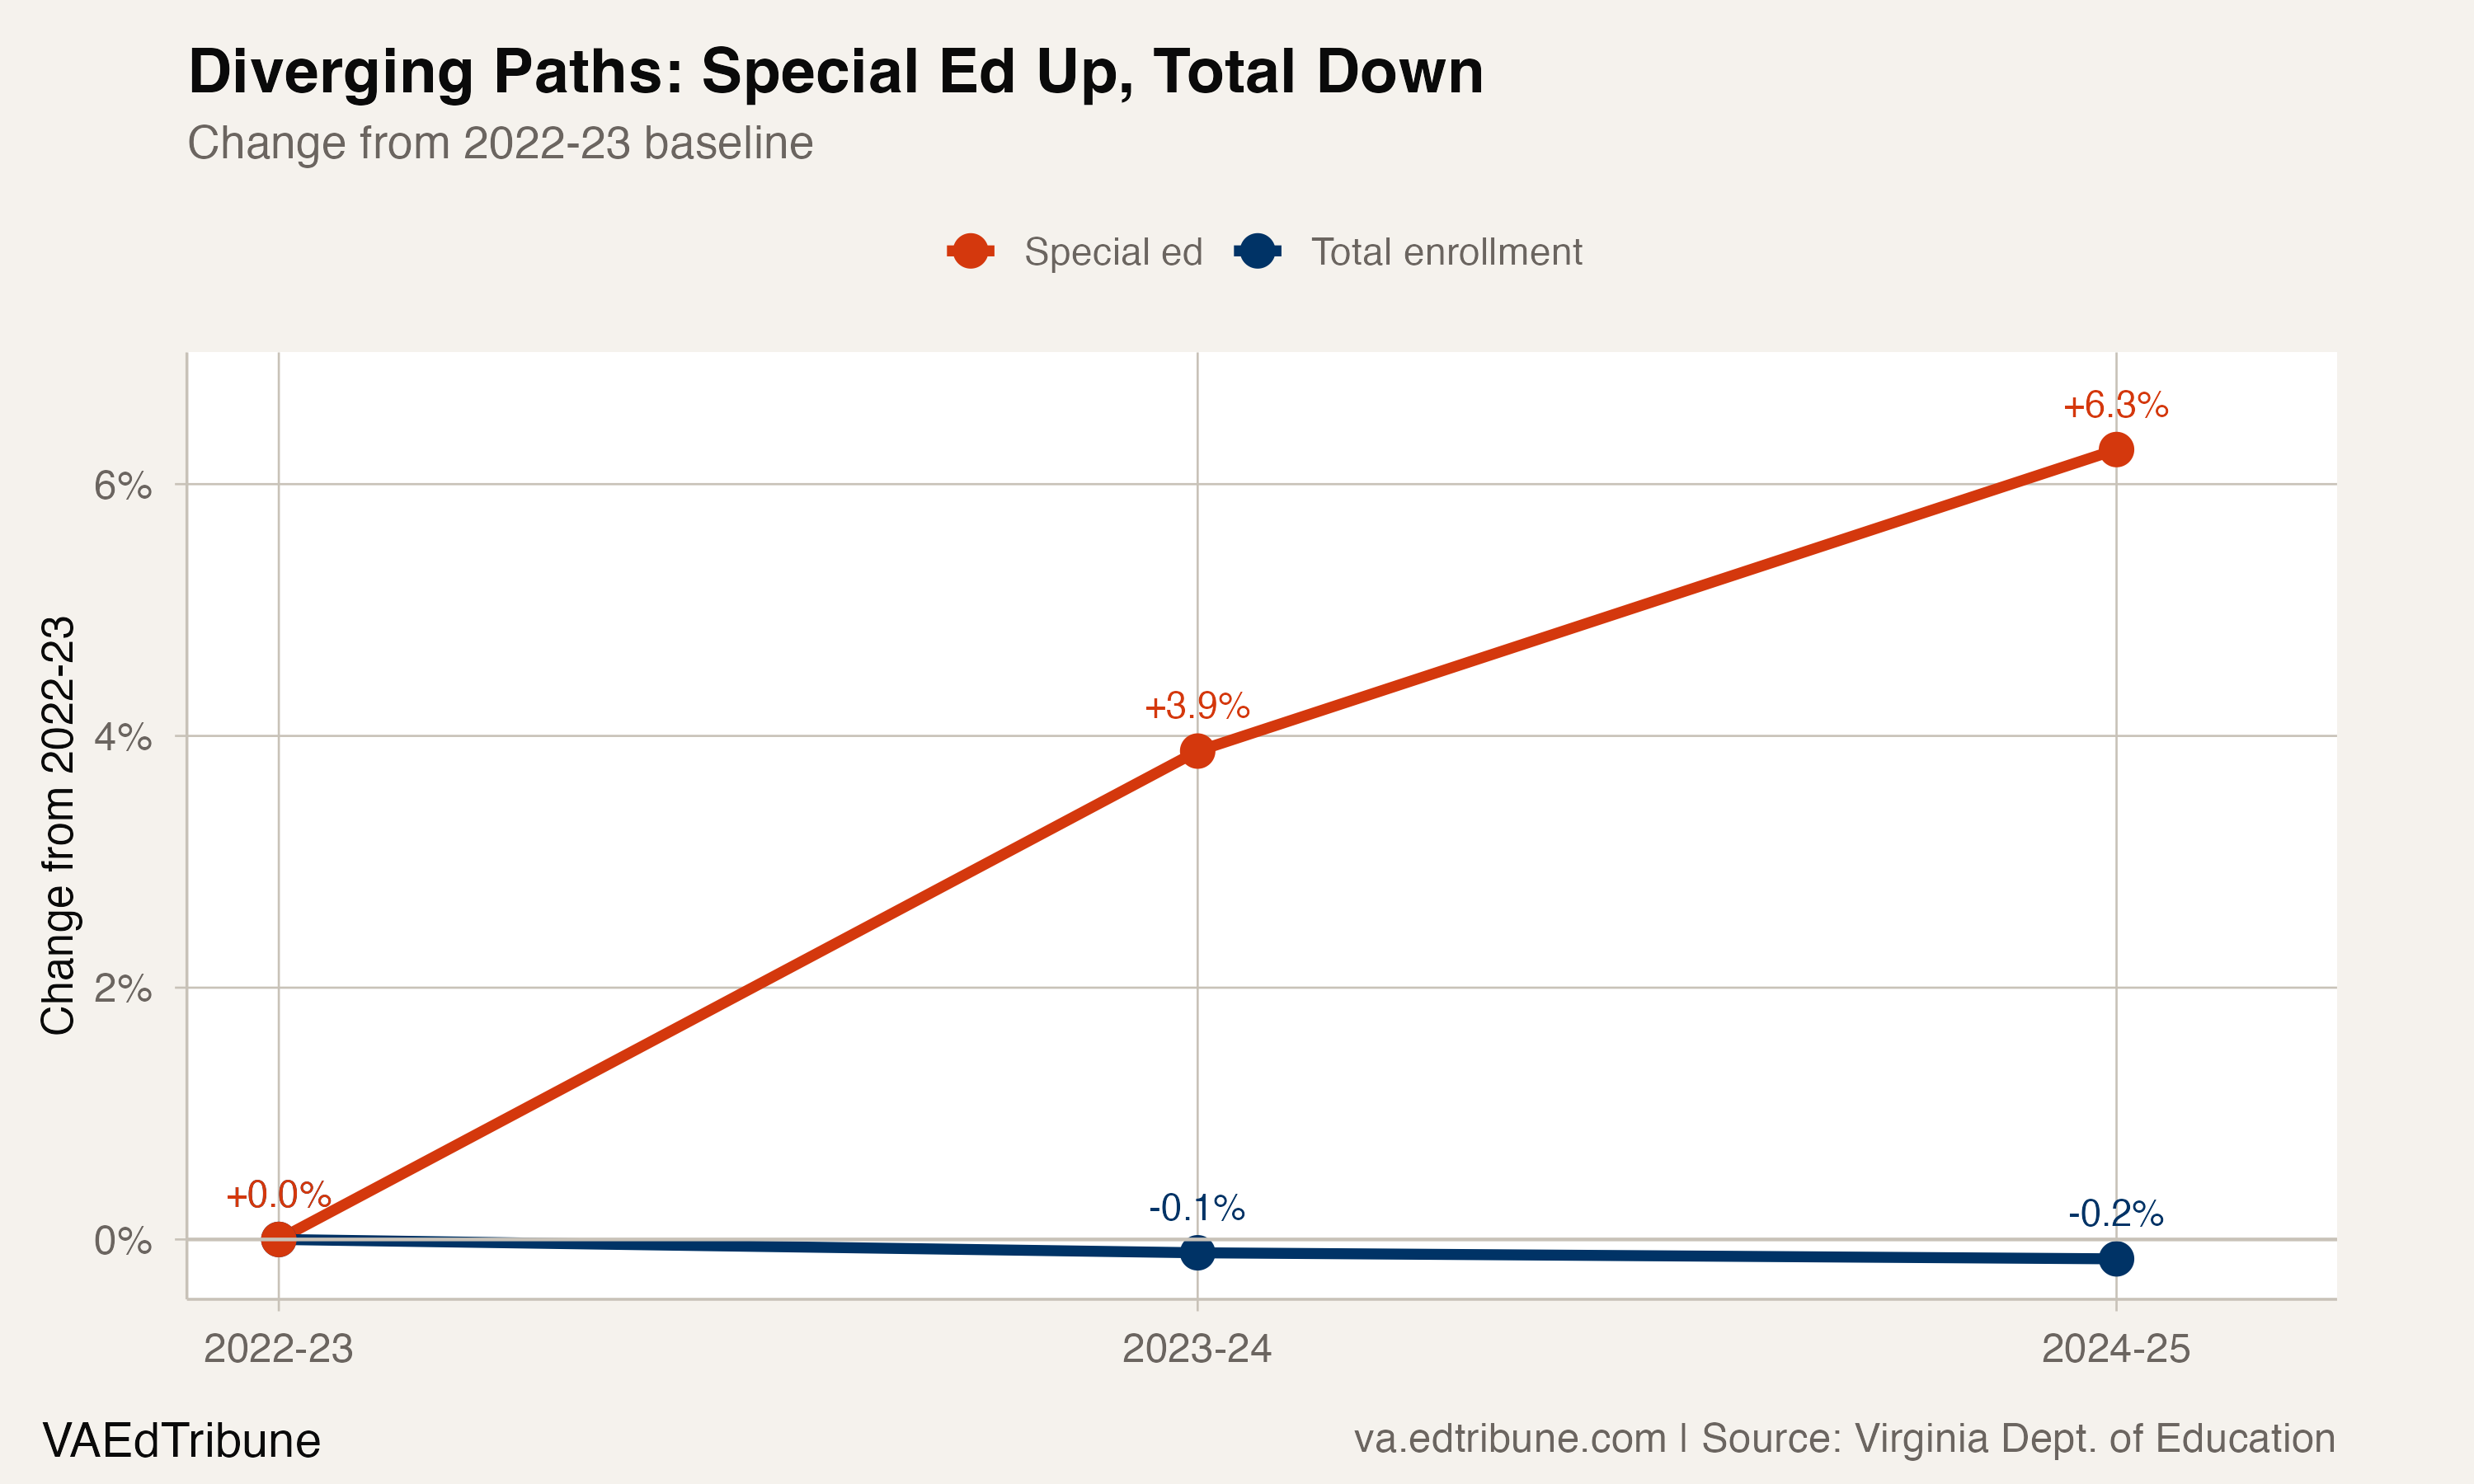
Between 2022-23 and 2024-25, total enrollment slipped 0.2%. Special education enrollment grew 6.3%. The gap between those two trajectories, roughly 6.5 percentage points, means the share of students entitled to specialized instruction is accelerating faster than the headline enrollment numbers suggest.
The identification rate rose from 13.8% to 14.7% in two years, a 0.9 percentage-point increase. Direct evidence: Virginia's rate sits close to the national average of about 15%, where nearly 8.2 million students ages 3 to 21 qualified for services in 2024, an increase of more than 300,000 in a single year.
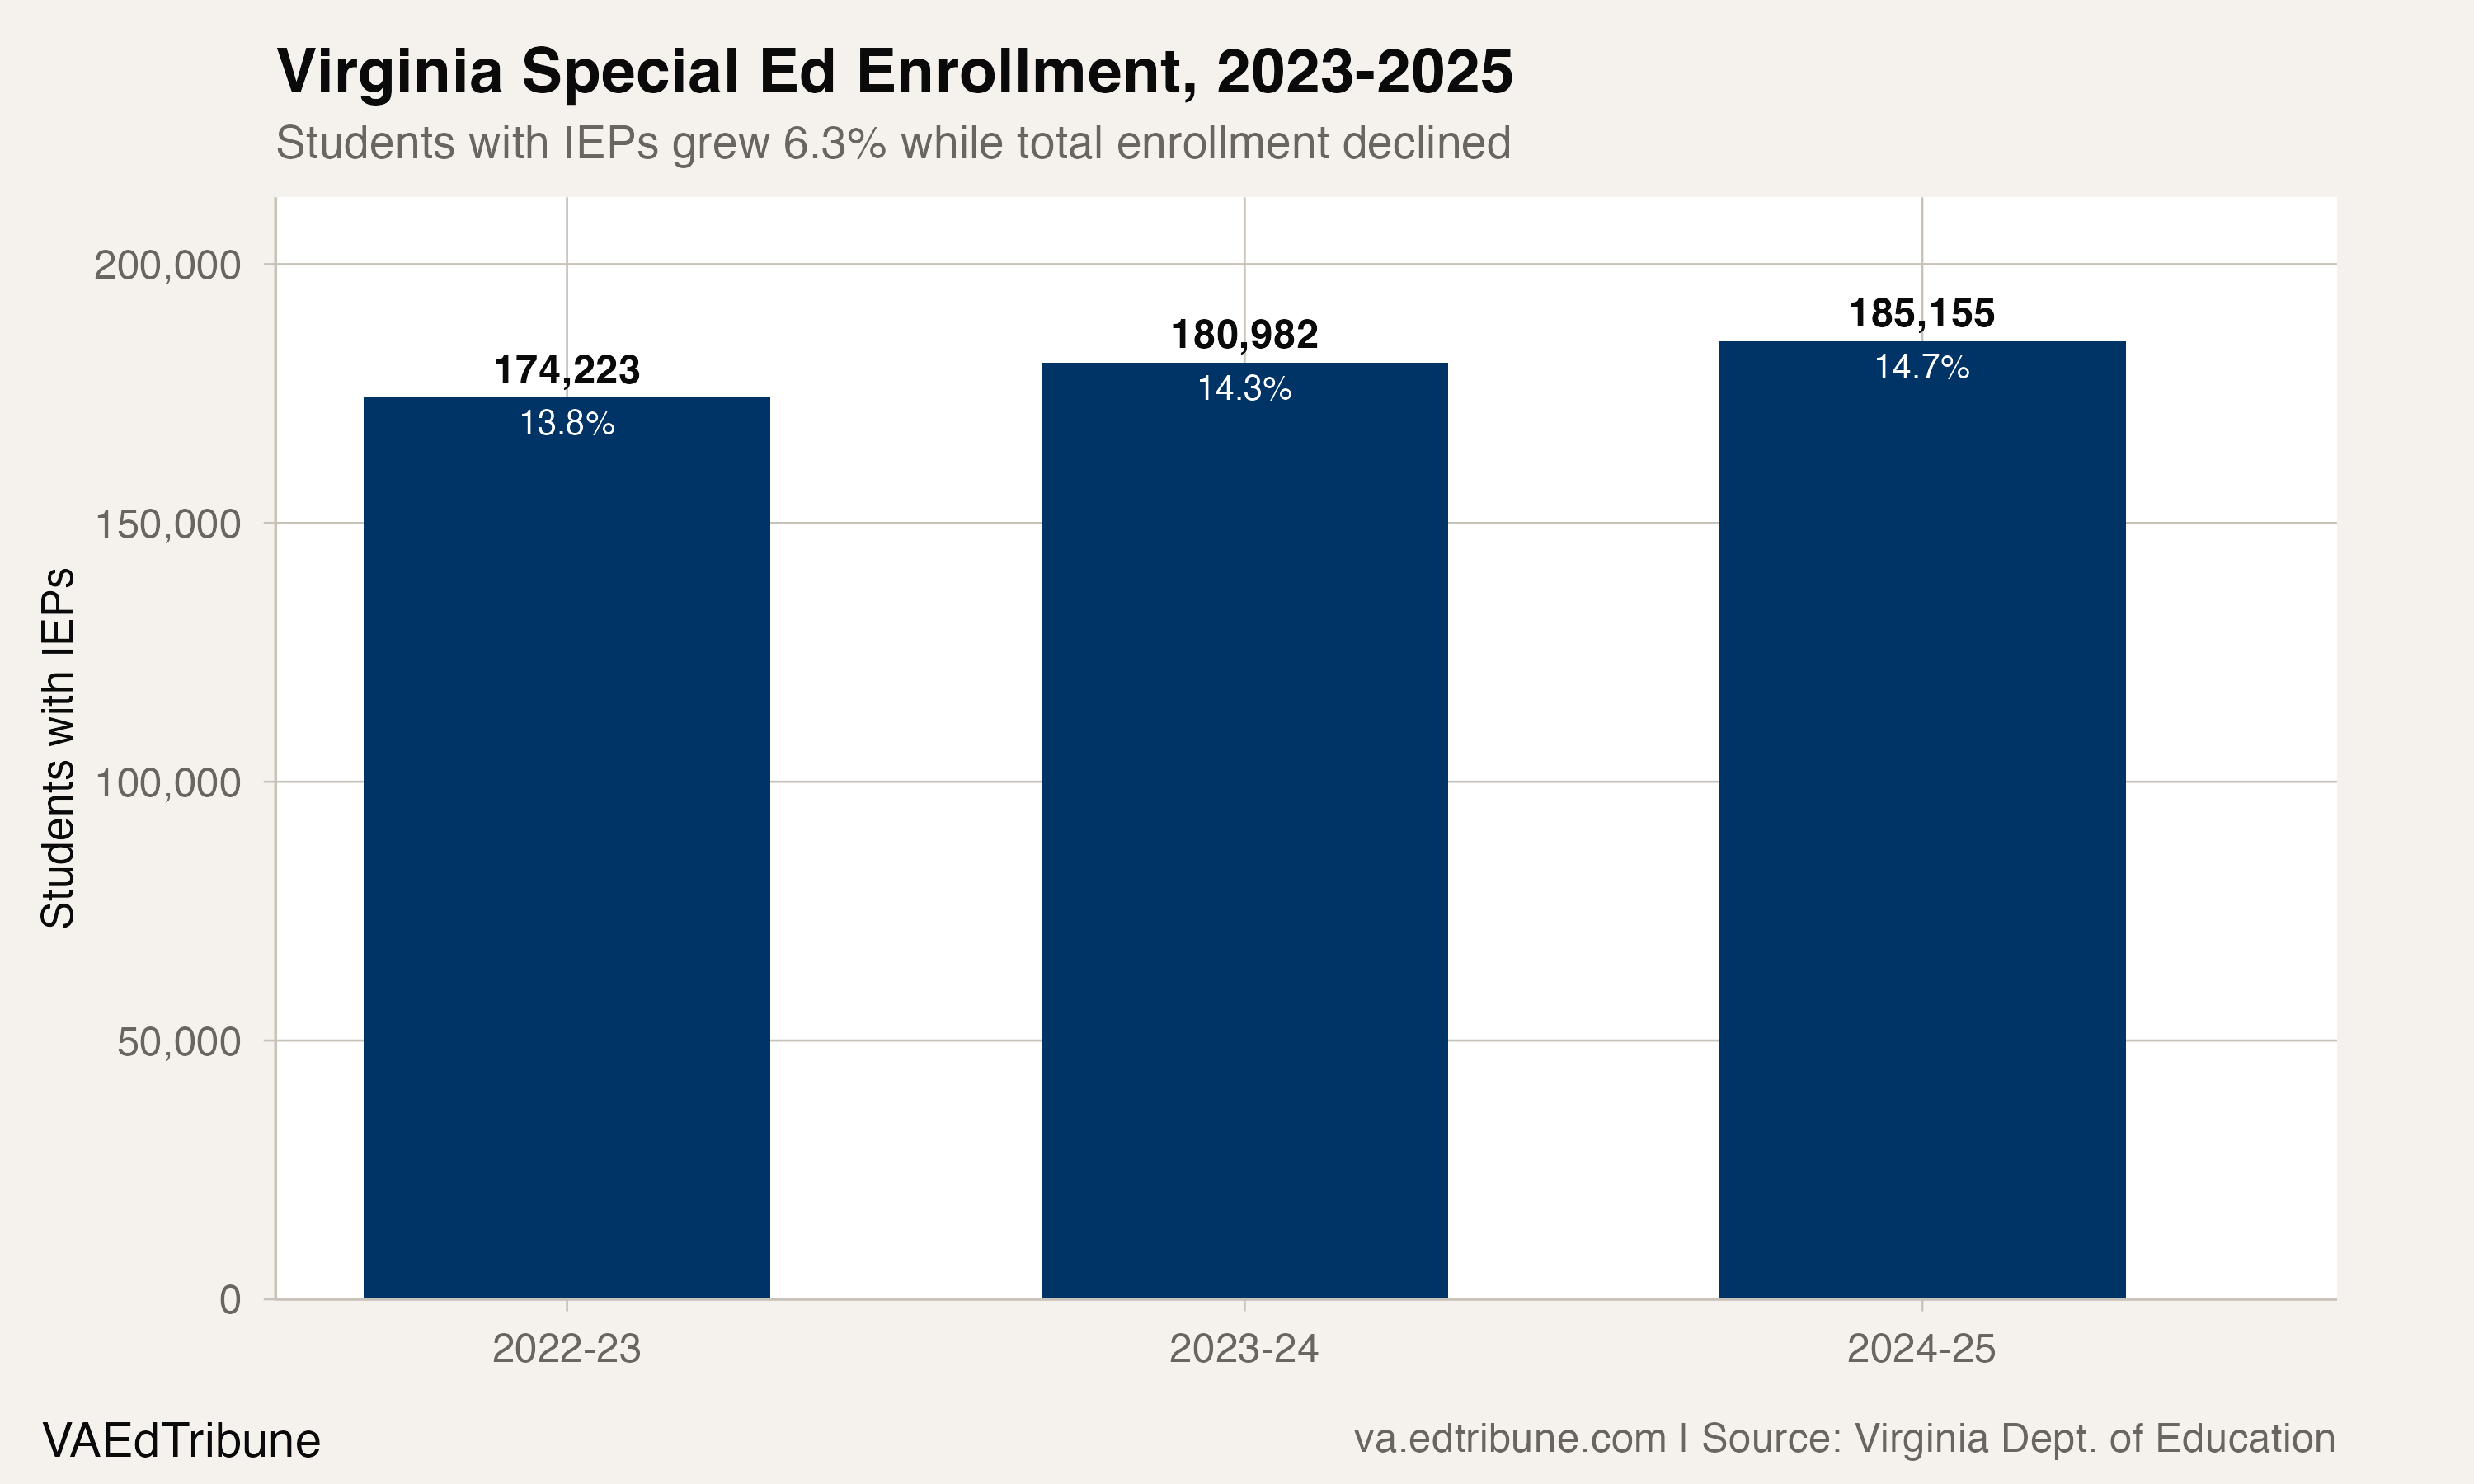
The year-over-year pattern shows the bulk of the growth loaded into the first year: 6,759 new IEP-eligible students in 2023-24 (a 3.9% jump), followed by 4,173 more in 2024-25 (2.3%). Unresourced: the VA enrollment package does not show whether that deceleration signals a plateau or simply reflects the timing of evaluations.
Where the growth concentrates
Fairfax County↗ET added 2,743 special education students in two years, more than any other division and roughly a quarter of the statewide increase. Its special education rate rose to 16.9%, above the state average, in a division that enrolls 180,559 students total. Prince William added 982, Loudoun 799.
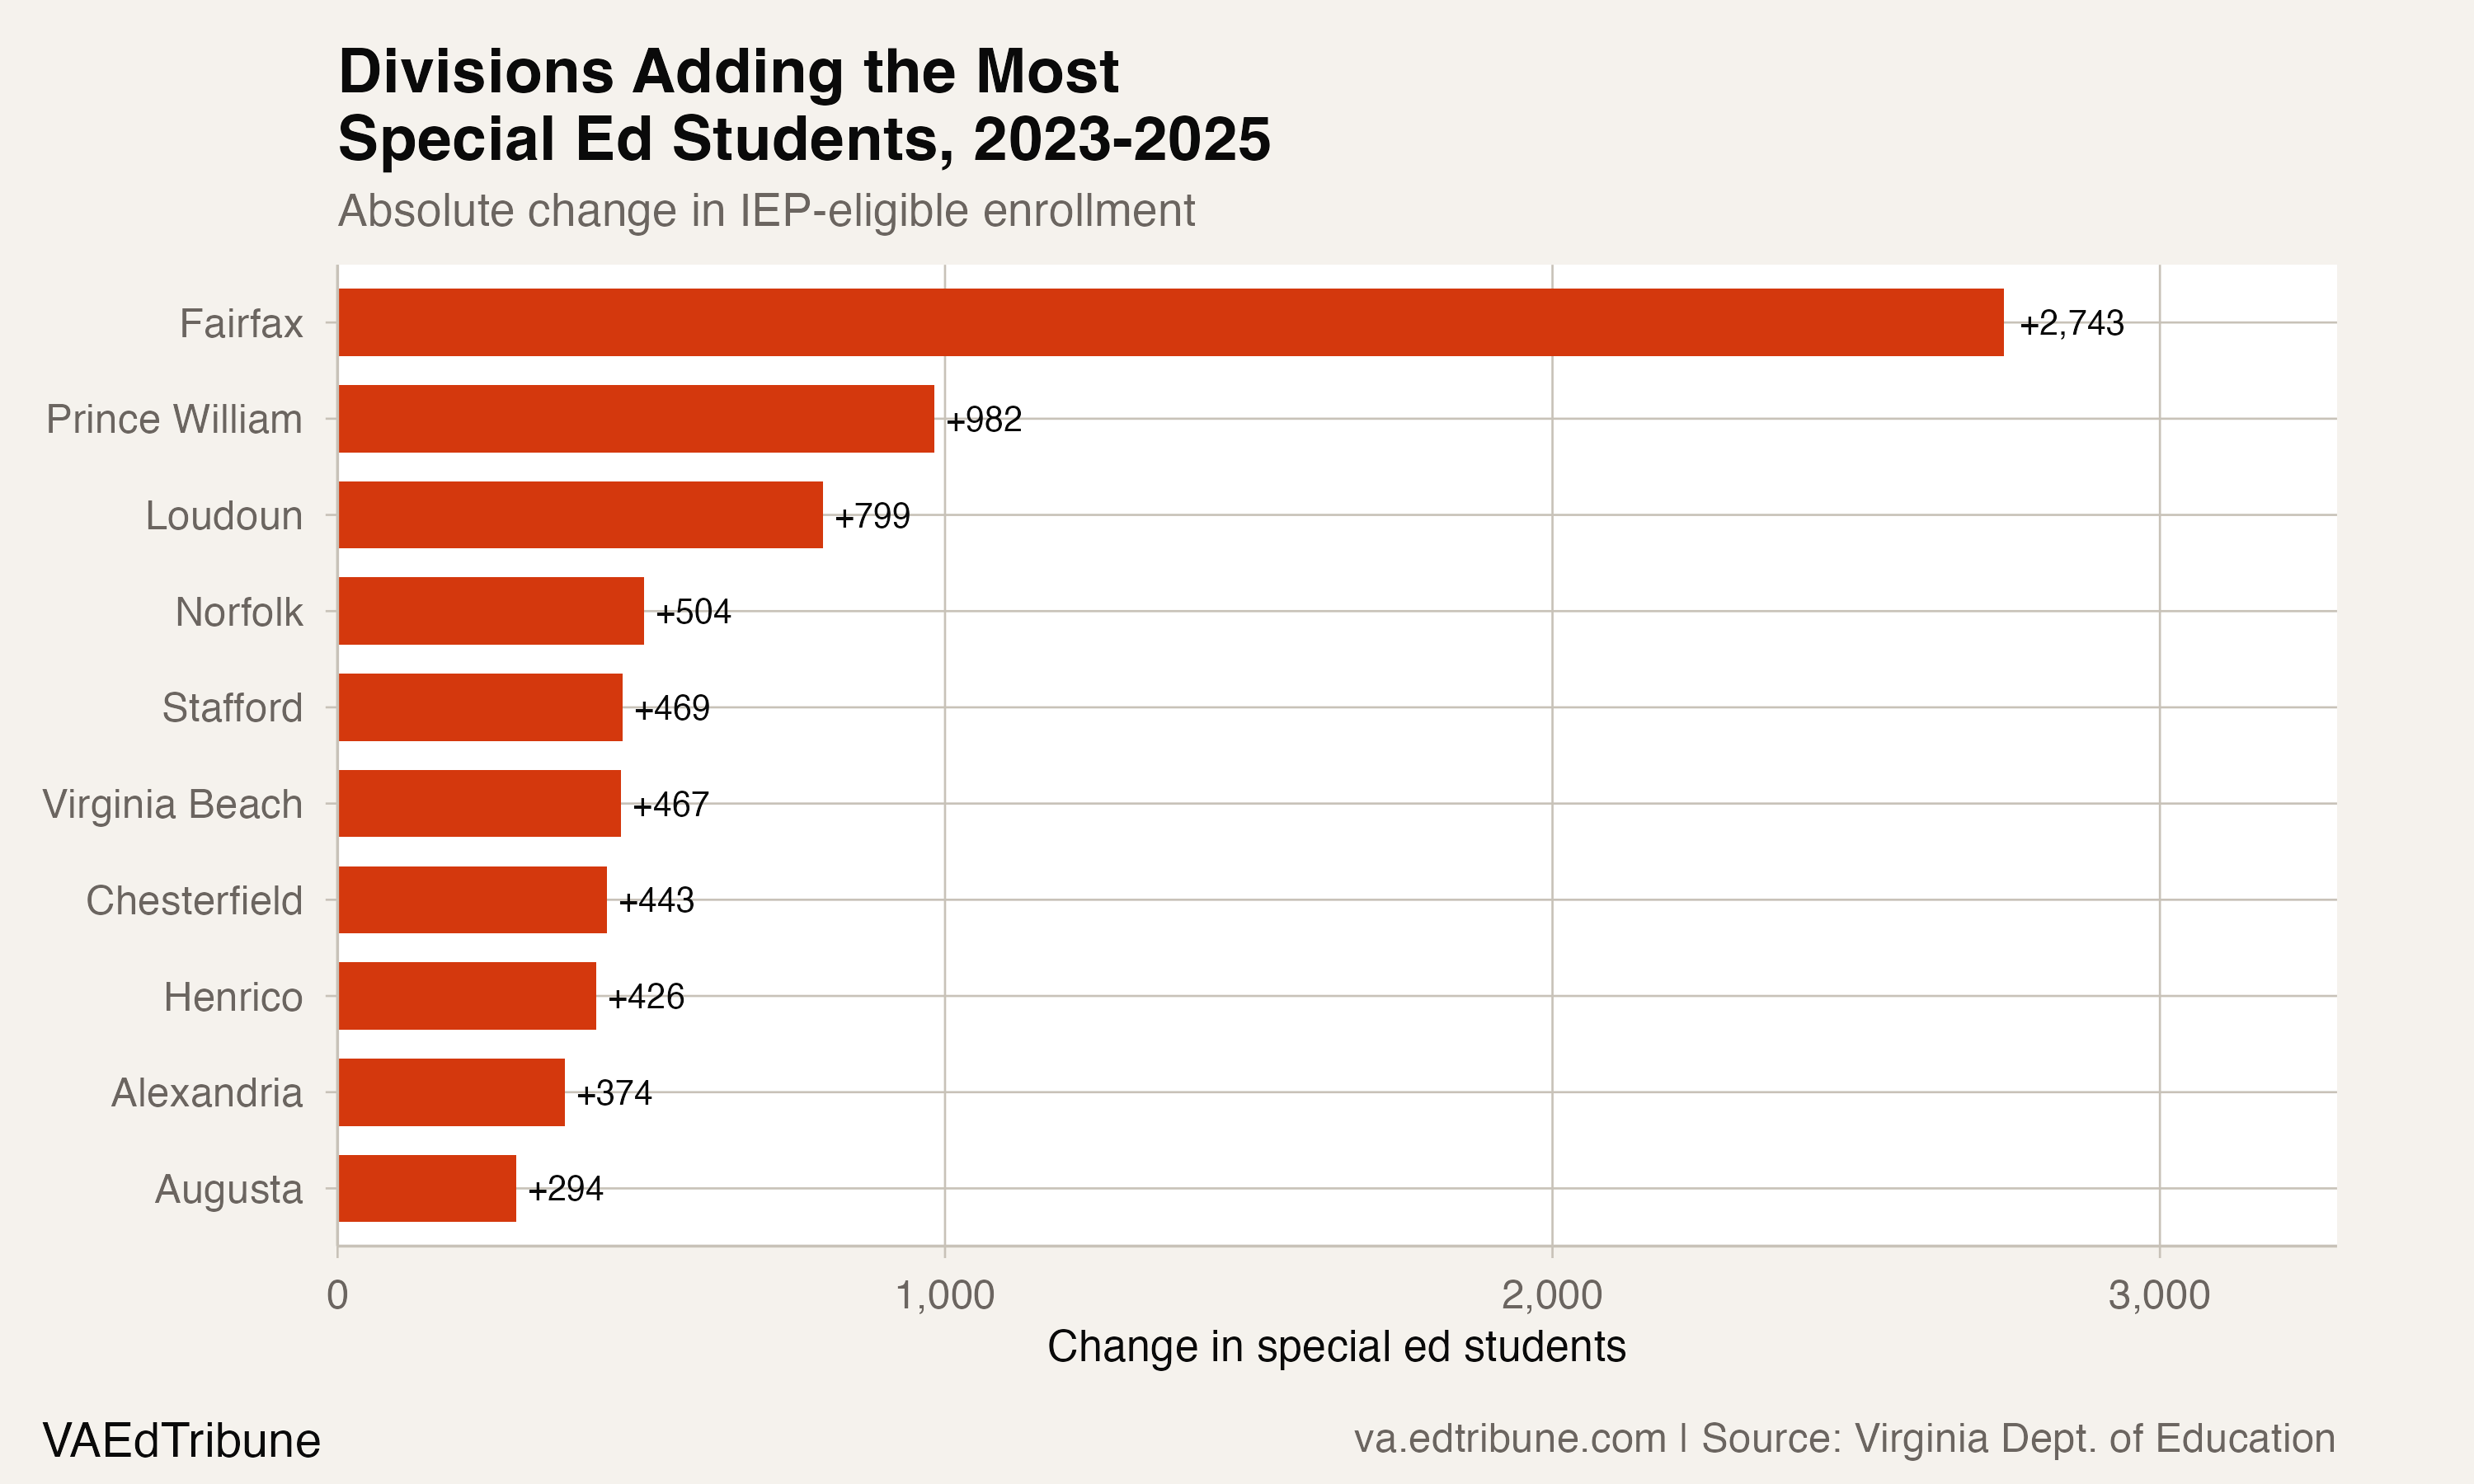
Northern Virginia's three largest divisions account for 4,524 of the 10,932-student increase, or 41.4%. Suggestive context: that concentration matters because NoVA divisions already face some of the state's highest per-pupil costs for specialized instruction. In Fairfax, the average cost per special education service was $18,421 in FY 2024, a figure that includes speech therapy, occupational therapy, and dedicated instructional support.
Smaller divisions show even higher identification rates but far fewer resources to absorb them. Buchanan County↗ET in Southwest Virginia identifies 21.8% of its students for special education services, the highest rate among divisions with at least 500 IEP-eligible students. Scott County (18.9%), Lee County (18.5%), and Carroll County (18.4%) cluster close behind. Suggestive context: the Appalachian Regional Commission lists Buchanan, Scott, Lee, and Carroll counties as part of Appalachian Virginia.
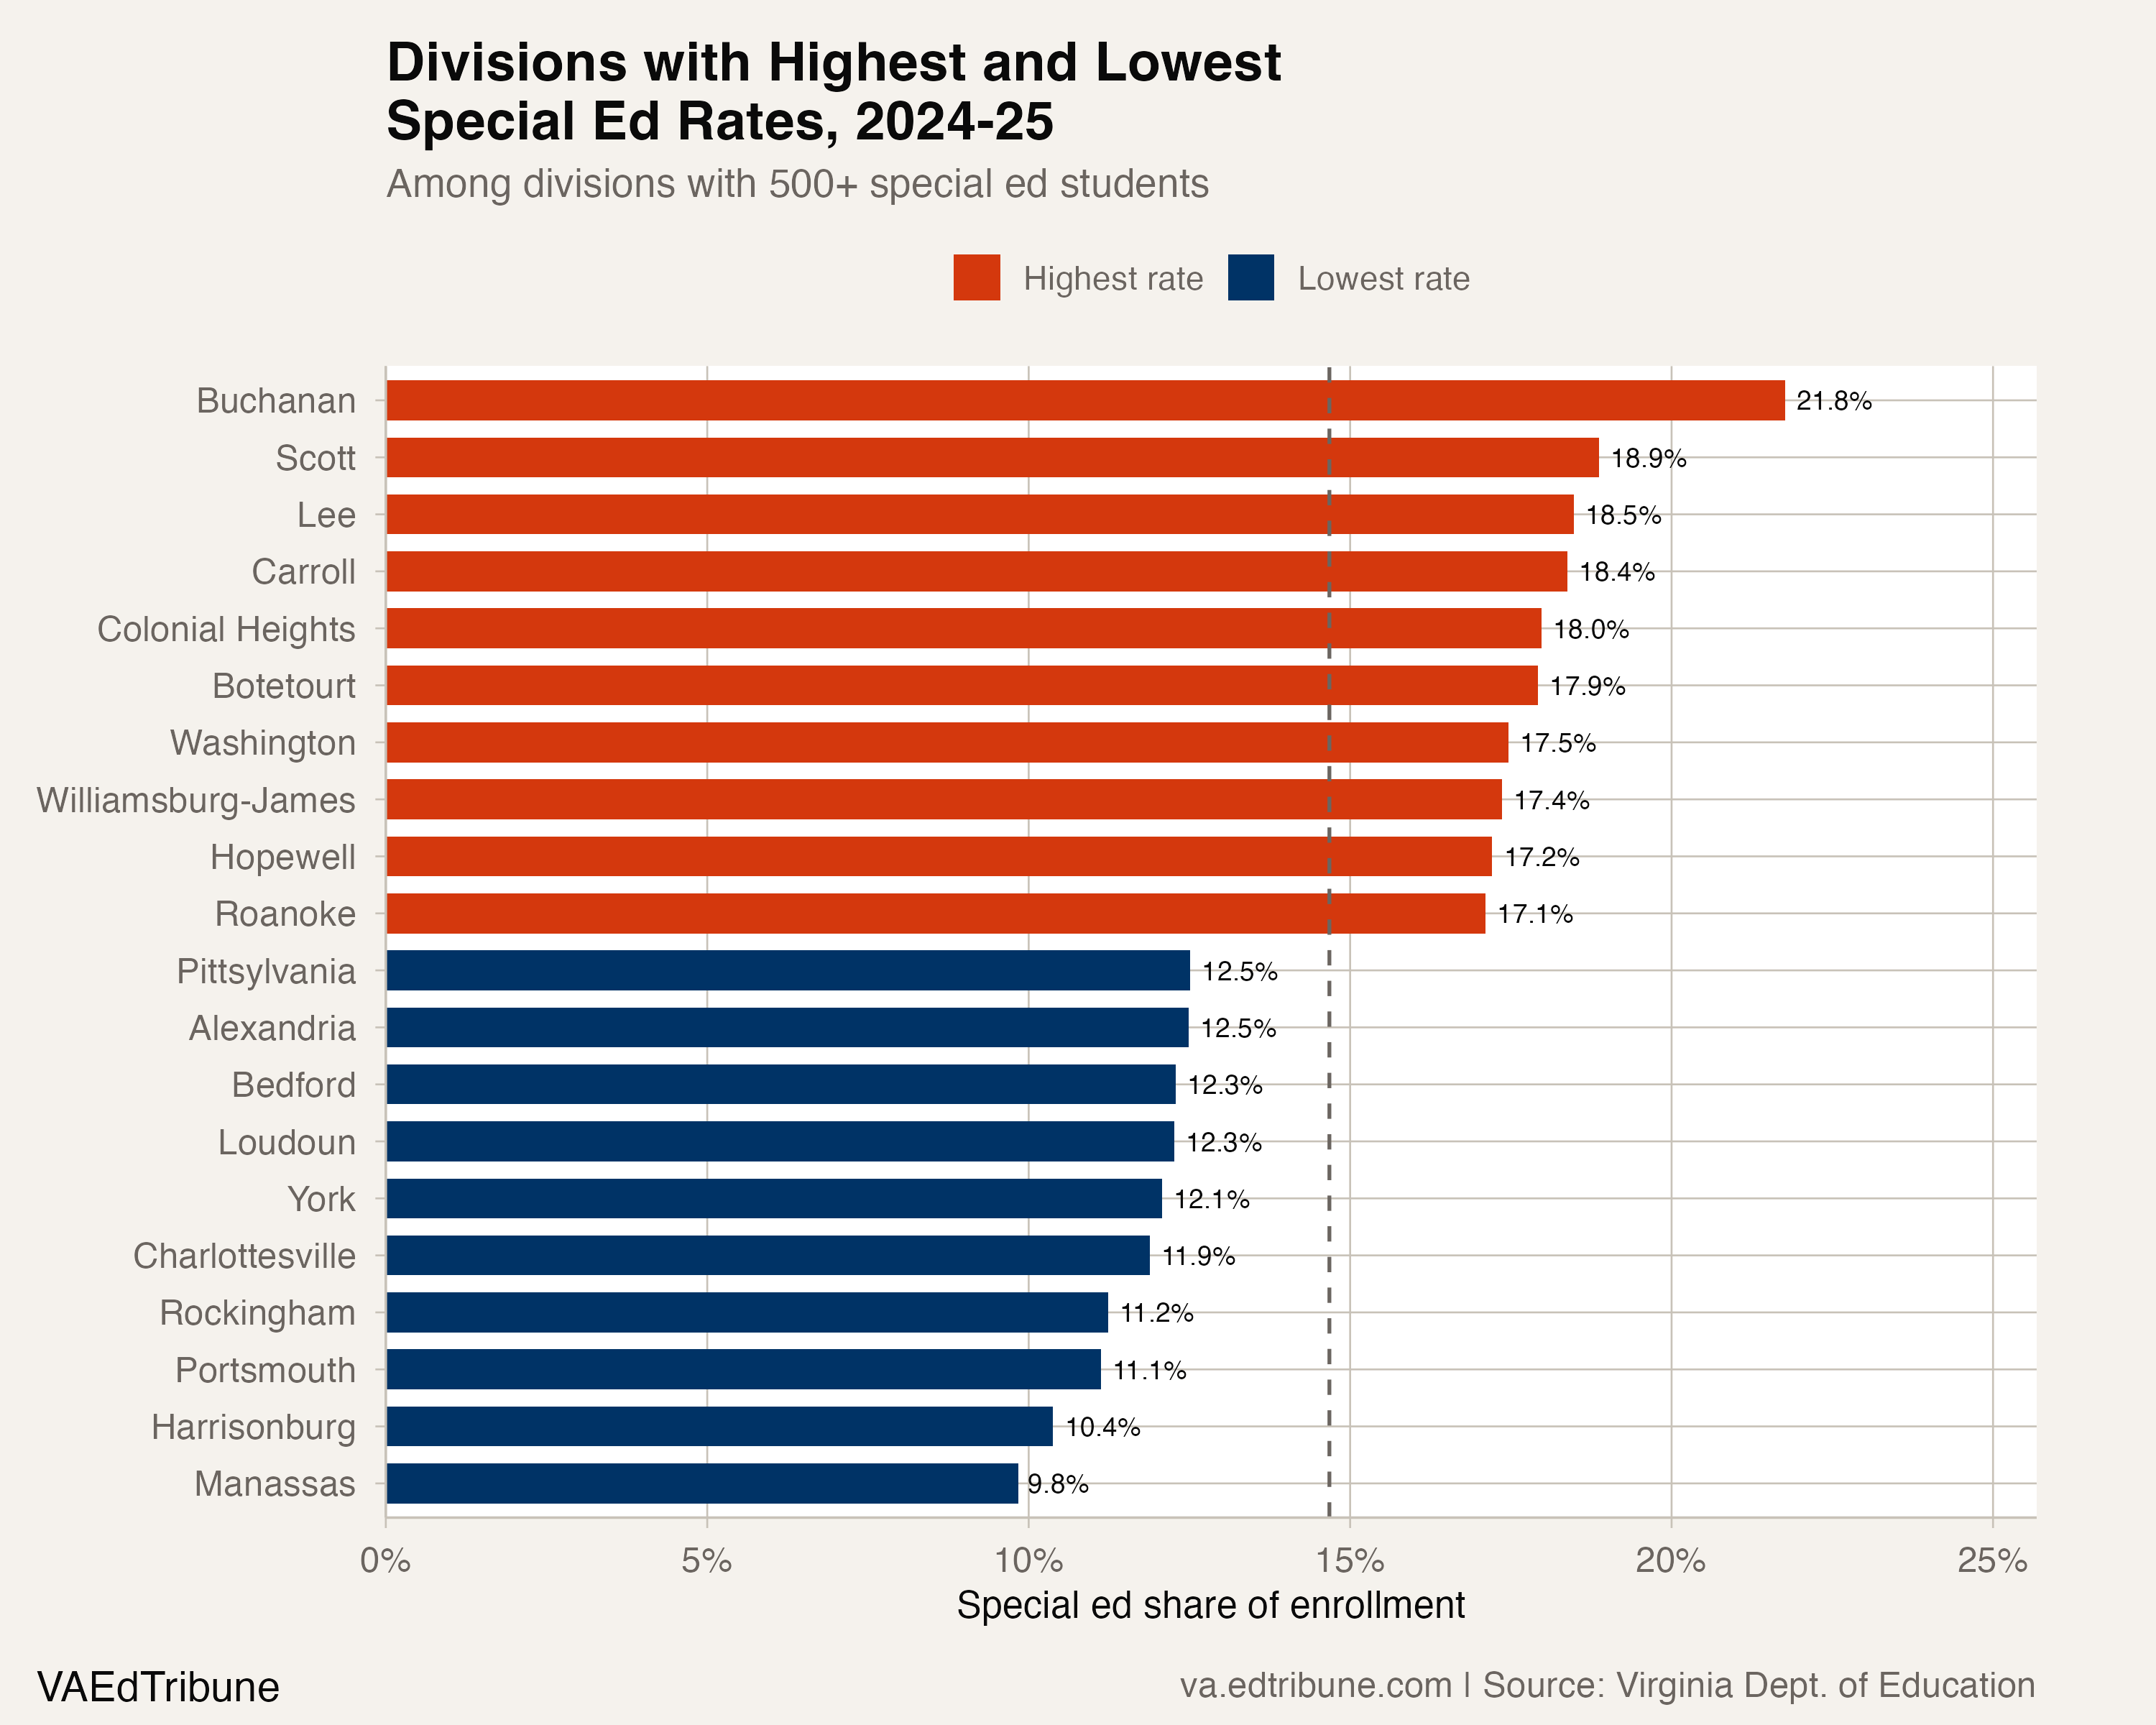
At the other end, Manassas City↗ET reports a 9.8% special education rate, the lowest among divisions with at least 500 IEP students. Harrisonburg (10.4%) and Portsmouth (11.1%) are also well below the state average. Direct evidence: Manassas City is majority-LEP, at 52.3%, and Harrisonburg is near-majority-LEP, at 44.1%. Unresourced: the data alone cannot say whether lower identification rates in high-LEP divisions reflect genuinely lower prevalence or underidentification in communities where language barriers complicate the evaluation process.
Identification, not arrival
Direct evidence: Virginia's special education enrollment grew while total enrollment declined. Unresourced: the VA package does not track whether newly identified students were already enrolled, transferred from another public division, or arrived with existing IEPs, so it cannot assign the growth to a single pathway.
Direct evidence: nationally, autism diagnoses accounted for 40% of special education enrollment growth in the most recent federal count. Unresourced in Virginia: this article does not measure whether broader screening, greater awareness of autism spectrum disorder, or heightened attention to children's mental health is changing identification here.
Direct evidence: Virginia adopted regulatory changes for special education in March 2024 after a federal monitoring review, and the 2024 General Assembly passed HB 1089, requiring every school division to designate a special education parent/family liaison. Suggestive context: a liaison role designed to help families navigate referral and evaluation could generate additional evaluations as more parents learn they can request them, but the article does not measure that effect.
Competing explanation: post-pandemic academic and behavioral struggles may be pushing more students into formal evaluation pipelines. A 2025 study of Michigan's special education trends during COVID found that pandemic-era disruptions delayed identification but did not reduce the underlying need, creating a backlog that surfaced once schools returned to normal operations.
The $480 million question
The General Assembly's $52.8 million special education add-on, approved in the 2025 budget session, represents a 10% increase in state special education funding. It provides a 4.75% add-on to basic aid for students receiving Level 1 services and 5.25% for Level 2 services.
"Virginia has long underfunded special education compared to other states." -- Fund Our Schools VA, 2025 Legislative Session Recap
The $52.8 million is significant, but advocates note it addresses roughly 11% of an estimated $480 million gap between what the state formula provides for special education and what divisions actually spend. Direct evidence: per-pupil state funding for special education declined 16% over the preceding decade, according to a Fairfax County analysis of JLARC's 2023 K-12 funding study. The Virginia Association of Counties summarized JLARC's special education review as finding that local funds covered 69% of special education costs in FY 2019.
Suggestive context: for divisions already running deficits, declining base enrollment and growing demand for specialized instruction create a budget vise. Fewer total students can mean less formula funding. More IEP-eligible students means higher costs for the specialized programs those students are entitled to receive. The $52.8 million add-on eases the pressure but does not resolve it.
Staffing the gap
Norfolk↗ET added 504 special education students in two years, a 13.3% increase, while its total enrollment continued a 22-year decline. Alexandria↗ET added 374 students, a 22.0% surge in its special education rolls. Both divisions must hire and retain special education teachers in a market where Virginia consistently ranks among the states with the highest special education teacher attrition rates.
Direct evidence: the state has expanded pipeline programs. Between June 2024 and September 2025, 600 teachers completed the iteach alternative certification program, with 114 earning a special education endorsement. VDOE offered complimentary professional memberships and development sessions to more than 1,000 first- and second-year special education teachers during 2024-25. But with 784 vacancies and rising caseloads, the pipeline remains short of demand.
The next VDOE special-populations release is the next data point to watch. If the identification rate continues to climb at the 2022-23 to 2024-25 pace, Virginia would cross 15% by 2026-27, roughly one in 6.4 students statewide. Buchanan County is already above 20%. Three data points establish a direction but not a trajectory, and national figures suggest special education enrollment has been climbing for at least five years. Virginia's recent growth may be unremarkable by national standards, or it may be a lagged response that still has room to run.
Detailed code that reproduces the analysis and figures in this article is available exclusively to EdTribune subscribers.
Discussion
Sign in to join the discussion.
Loading comments...